
CEOs should not track every marketing metric.
They should focus exclusively on KPIs tied to revenue, capital efficiency, and scalable growth.
Most marketing dashboards look cluttered and have too many (and often less relevant) metrics such as website traffic, social media engagement, email open rates, and MQL volume.
These metrics don’t translate to business outcomes.
CEOs need a filtered view showing whether marketing drives predictable revenue, acquires customers efficiently, and supports the company’s growth.
This difference is critical.
Often, marketing teams optimize for activity metrics (leads generated, content published, campaigns launched) while CEOs must evaluate business impact (CAC trends, pipeline contribution, revenue attribution, LTV improvements).
This misalignment causes friction.
Marketing reports “success” through vanity metrics while the CEO sees stagnant revenue or deteriorating unit economics.
Executive-level marketing KPIs answer three critical questions:
- Is marketing acquiring customers at sustainable cost?
- Is marketing contributing predictably to revenue?
- Is marketing efficiency improving or declining?
The goal of this in-depth guide about ‘marketing KPIs every CEO should track’ is to identify the specific metrics CEOs should monitor weekly, monthly, and quarterly.
And create accountability frameworks that align marketing with business outcomes investors and boards actually care about.

Why CEOs Need Different Marketing KPIs Than Marketing Teams?
Executive oversight requires strategic metrics.
Tactical dashboards tracking every campaign detail don’t serve this purpose.
This is why marketing KPIs every CEO should track are not always the same as what marketing teams track.
Strategic Oversight vs Tactical Metrics
Marketing teams track tactical KPIs showing daily execution.
These are metrics such as click-through rates on ads, landing page conversion rates, email engagement, content performance, social media metrics, and campaign-specific results.
While these metrics help marketers optimize tactics, they don’t tell CEOs whether marketing is working at a business level.
CEOs need strategic metrics showing trends and outcomes:
- Customer acquisition cost trajectory: Is it rising or falling over time?
- Pipeline contribution as percentage of total opportunities: Is marketing creating enough pipeline to hit revenue targets?
- Marketing-attributed revenue: What percentage of closed deals originated from marketing?
- Unit economics trends: Is the business becoming more or less efficient at converting spend to revenue?
Strategic metrics answer “should we invest more in marketing or restructure our approach?”
Revenue Alignment
Marketing teams often celebrate lead generation milestones.
For example, they might celebrate when they generate 500 MQLs in a month.
The issue is they do not connect those leads to revenue outcomes.
CEOs must see the complete picture:
- How many of those 500 MQLs became sales-qualified leads?
- How many converted to opportunities?
- How many closed as customers?
- What was the revenue value?
- What did it cost to generate?
Revenue-aligned KPIs create accountability:
- Marketing isn’t successful because they generated activity
- Marketing is successful because they contributed measurably to revenue targets.
This shift from activity to outcomes changes marketing behavior.
And teams focus on lead quality and conversion optimization rather than chasing volume.
Board Accountability
Boards and investors evaluate marketing through three lenses:
- Capital efficiency: CAC and CAC payback period showing marketing isn’t burning cash inefficiently
- Growth predictability: Pipeline trends and conversion rates demonstrating repeatable, scalable customer acquisition
- Unit economics: LTV:CAC ratios proving business model sustainability
Board-level KPIs must translate marketing performance into language investors understand.
Instead of marketing jargon, there should be financial metrics showing marketing’s contribution to company value.
Capital Efficiency
For startups and growth companies, every dollar spent must justify itself through near-term revenue contribution or long-term strategic positioning.
CEOs tracking capital efficiency need to know:
- Marketing spend as percentage of revenue: Here are the industry benchmarks. 10-20% for established companies, 20-40% for aggressive growth-stage
- CAC payback period: How many months to recover customer acquisition cost through gross margin?
- Marketing efficiency ratio: Revenue generated per dollar of marketing spend
These efficiency metrics determine whether to increase marketing investment, restructure approach, or optimize execution.
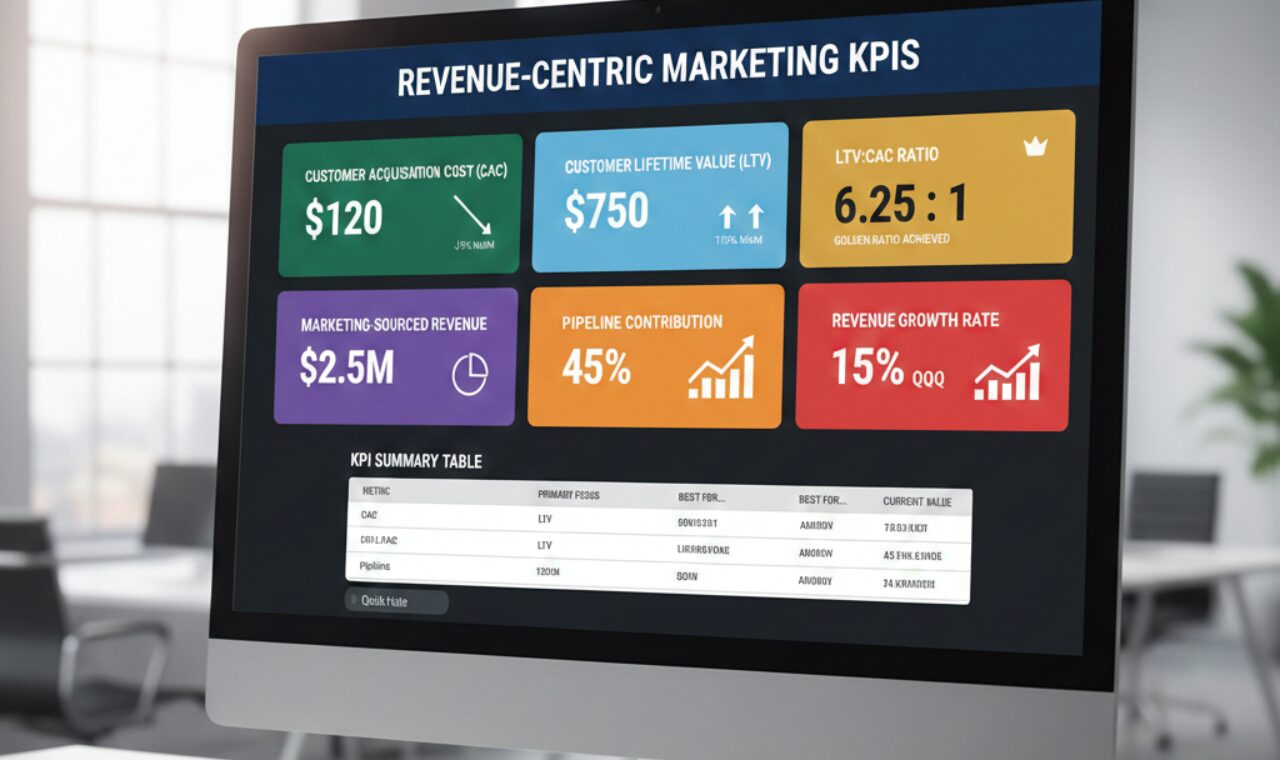
Revenue-Centric Marketing KPIs
These metrics directly connect marketing activity to business outcomes and revenue generation.
Customer Acquisition Cost (CAC)
What it measures:
Total marketing and sales expense divided by number of new customers acquired in a given period.
Why CEOs care:
CAC trends show whether customer acquisition is becoming more or less efficient over time.
Rising CAC without corresponding LTV increases threatens business sustainability.
Eventually, acquisition costs exceed customer value and growth becomes uneconomical.
How to calculate:
(Total marketing spend + total sales spend) ÷ number of new customers = CAC.
Include salaries, tools, ad spend, agencies, events-everything required to acquire customers.
What good looks like:
CAC declining or stable over time while maintaining growth velocity.
For SaaS businesses, CAC under 12 months of customer revenue is generally sustainable; under 6 months is excellent.
B2B companies typically see $3,000-$15,000 CAC.
B2C varies widely but should remain below 30-40% of LTV.
Red flags:
CAC rising quarter-over-quarter without strategic explanation (new market entry, upmarket move).
Inability to attribute CAC by channel or cohort.
The marketing team can’t explain what’s driving CAC changes.
Customer Lifetime Value (LTV)
What it measures:
Total revenue a customer generates over their entire relationship with the company, net of costs to serve them.
Why CEOs care:
LTV determines how much the company can afford to spend acquiring customers.
High LTV businesses can sustain higher CAC and more aggressive growth strategies.
LTV improvements through better product-market fit, lower churn, or expansion revenue fundamentally change business economics.
How to calculate:
(Average revenue per customer × gross margin %) ÷ churn rate = LTV.
For SaaS: (Monthly recurring revenue per customer × gross margin) ÷ monthly churn rate. Include expansion revenue from upsells and cross-sells.
What good looks like:
LTV increasing over time through product improvements, better customer fit (marketing attracts customers who stay longer), or expansion revenue.
LTV should significantly exceed CAC-see LTV:CAC ratio below.
Red flags:
LTV declining (customers churning faster or spending less).
Cohort analysis showing newer customers have lower LTV than earlier cohorts.
Inability to predict LTV accurately due to short operating history or high churn volatility.
LTV:CAC Ratio
What it measures:
How many times customer lifetime value exceeds customer acquisition cost.
Why CEOs care:
This ratio determines business model sustainability and growth potential.
LTV:CAC ratios under 3:1 suggest the business isn’t generating sufficient return on acquisition investment.
Ratios above 5:1 might indicate under-investment in growth-the company could acquire customers more aggressively.
How to calculate:
LTV ÷ CAC = ratio.
A ratio of 4:1 means each dollar spent acquiring customers generates four dollars of lifetime value.
What good looks like:
3:1 to 5:1 ratio is generally healthy for most businesses.
SaaS companies often target 3:1 as minimum viable, with 4:1+ being strong.
Combined with CAC payback under 12 months, these metrics indicate scalable, efficient growth.
Red flags:
Ratio declining toward 2:1 or below (unsustainable unit economics).
Ratio above 7:1 for extended periods (potential under-investment in growth, leaving market share to competitors).
Significant variance between cohorts (inconsistent customer fit or acquisition efficiency).
Marketing-Sourced Revenue
What it measures:
Percentage of total revenue that originated from marketing-generated opportunities versus sales-sourced leads.
Why CEOs care:
This metric shows whether marketing is creating an independent pipeline or merely supporting sales-driven deals.
High marketing-sourced revenue indicates repeatable, scalable demand generation.
Low percentage suggests over-reliance on founder networks, sales outbound, or one-off partnerships that don’t scale.
How to calculate:
(Revenue from marketing-sourced opportunities ÷ total revenue) × 100 = marketing-sourced percentage.
Track via CRM attribution showing first touchpoint or multi-touch attribution model.
What good looks like:
30-50% marketing-sourced revenue for companies with mature marketing functions.
Early-stage companies (Series A) might be 15-30% as they build marketing capabilities.
Enterprise B2B companies with long sales cycles may see 40-60% marketing-influenced (touched the deal at some point) even if not first-touch source.
Red flags:
Marketing-sourced percentage declining over time (indicating diminishing marketing effectiveness).
Attribution models broken or non-existent (can’t determine what’s working).
Marketing claims 100% attribution (unrealistic-sales almost always contributes).
Pipeline Contribution
What it measures:
Dollar value of qualified opportunities in the sales pipeline that originated from marketing efforts.
Why CEOs care:
Pipeline contribution is a leading indicator of future revenue.
If marketing must contribute $3 of pipeline to generate $1 of revenue (based on historical win rates and sales cycle length), CEOs can forecast future revenue based on current pipeline contribution and identify gaps requiring attention.
How to calculate:
Sum of opportunity values in CRM with marketing attribution.
Track monthly or quarterly and compare to the pipeline targets derived from revenue goals.
What good looks like:
Marketing consistently generates pipeline equal to 40-60% of the total new pipeline (combined with sales-sourced opportunities).
Pipeline contribution trends upward as marketing matures.
Pipeline quality (conversion rates) matches or exceeds sales-sourced opportunities.
Red flags:
Pipeline contribution percentage declining. Marketing-sourced opportunities have significantly lower win rates than sales-sourced (indicates poor lead quality).
Pipeline generated doesn’t align with revenue targets (if $10M revenue target requires $30M pipeline at 33% win rate, and marketing generates only $8M pipeline with 40% contribution, there’s a $4M gap).
Revenue Growth Rate
What it measures:
Month-over-month or year-over-year revenue growth percentage.
Why CEOs care:
Growth rate determines company valuation, fundraising success, and market competitiveness.
Marketing directly impacts growth through customer acquisition volume and efficiency.
Stagnant growth despite increased marketing spend signals strategic problems requiring executive attention.
How to calculate:
((Current period revenue – prior period revenue) ÷ prior period revenue) × 100 = growth rate.
Track monthly for fast-growth companies, quarterly for mature businesses.
What good looks like:
Consistent growth (20-50% YoY for growth-stage companies, 10-30% for mature companies) with predictable, repeatable drivers.
Growth accelerating or maintaining despite increasing scale.
Marketing’s contribution to growth (measured through attribution) clear and increasing.
Red flags:
Growth decelerating despite increased marketing investment.
Volatile month-to-month growth indicating unpredictable customer acquisition.
Inability to attribute growth to specific marketing initiatives or channels (suggests lack of strategic control).
For comprehensive ROI analysis and revenue accountability frameworks, see fractional CMO ROI.
Efficiency Metrics CEOs Should Monitor
These KPIs measure how effectively marketing converts spend into business outcomes.
CAC Payback Period
What it measures:
Number of months required to recover customer acquisition cost through gross margin from that customer.
Why CEOs care:
CAC payback period determines cash flow dynamics and capital requirements.
Businesses with 18-month payback need significantly more working capital than those with 6-month payback.
Shorter payback periods enable faster growth with less external funding.
How to calculate:
CAC ÷ (monthly recurring revenue × gross margin %) = months to payback.
For $6,000 CAC, $500 MRR, 80% gross margin: $6,000 ÷ ($500 × 0.80) = 15 months.
What good looks like:
Under 12 months for SaaS and subscription businesses.
Under 6 months is excellent.
B2B service businesses may have longer payback (18-24 months) but should be consistently shortening.
Red flags:
Payback period extending (getting longer over time).
Payback exceeding 18-24 months for most business models (exception: enterprise deals with multi-year contracts and high LTV).
Inability to calculate payback (poor financial tracking or attribution).
Marketing Efficiency Ratio (MER)
What it measures:
Total revenue generated divided by total marketing spend for a given period.
Why CEOs care:
MER provides simple, high-level view of marketing ROI.
A MER of 4:1 means every dollar spent on marketing generates four dollars of revenue.
Tracking MER over time shows whether marketing efficiency is improving or declining.
How to calculate:
Total revenue ÷ total marketing spend = MER.
For $500,000 revenue and $125,000 marketing spend: $500,000 ÷ $125,000 = 4:1 MER.
What good looks like:
3:1 to 5:1 for most businesses, though targets vary by industry and business model.
Ratio improving or stable over time.
MER correlated with CAC and LTV metrics telling consistent efficiency story.
Red flags:
MER declining without strategic explanation (market changes, new product launch, pricing adjustments).
Significant gap between MER and expected performance based on CAC/LTV.
Marketing team unable to explain MER drivers or changes.
Cost Per Acquisition (CPA) by Channel
What it measures:
Customer acquisition cost broken down by specific marketing channel (paid search, paid social, content/SEO, events, partnerships).
Why CEOs care:
Channel-level CPA reveals which marketing investments deliver best returns and where to reallocate budget.
CPA by channel enables data-driven budget allocation decisions rather than intuition-based spending.
How to calculate:
Channel spend ÷ customers acquired from that channel = channel CPA.
Track in attribution system or CRM showing lead source to customer conversion.
What good looks like:
2-3 channels with CPA significantly better than others (indicating validated, scalable approaches).
CPA by channel stable or improving over time.
Clear understanding of why certain channels outperform (audience fit, message-market fit, competitive dynamics).
Red flags:
All channels showing similar mediocre CPA (lack of optimization).
CPA by channel deteriorating across all sources simultaneously (broader market or product issues).
Continuing investment in high-CPA channels without strategic rationale.
Conversion Rates by Funnel Stage
What it measures:
Percentage of prospects converting from one stage to the next (visitor → lead → MQL → SQL → opportunity → customer).
Why CEOs care:
Conversion rates identify bottlenecks in the customer journey.
A 50% improvement in one conversion stage compounds across the funnel-optimizing conversion is often more effective than increasing top-of-funnel volume.
How to calculate:
(Number progressing to next stage ÷ number in current stage) × 100 = conversion rate.
Calculate for each stage: visitor-to-lead, lead-to-MQL, MQL-to-SQL, SQL-to-opportunity, opportunity-to-customer.
What good looks like:
Conversion rates improving or stable.
Industry benchmarks vary, but general B2B SaaS ranges: visitor-to-lead 2-5%, lead-to-MQL 15-30%, MQL-to-SQL 30-50%, SQL-to-opportunity 40-60%, opportunity-to-customer 20-30%.
Aggregate funnel conversion (visitor to customer) typically 0.5-2%.
Red flags:
Specific conversion stage significantly underperforming (indicates where to focus optimization).
Conversion rates declining without explanation.
Massive drop-off at specific stage (broken process or misalignment).
Marketing Spend as % of Revenue
What it measures:
Total marketing budget as percentage of company revenue.
Why CEOs care:
This ratio benchmarks marketing investment intensity against peers and reveals whether marketing spend aligns with growth stage and strategy.
Under-investment limits growth; over-investment pressures profitability.
How to calculate:
(Annual marketing spend ÷ annual revenue) × 100 = marketing percentage of revenue.
What good looks like:
10-15% for established, profitable companies.
20-30% for growth-stage companies prioritizing market share.
30-50% for early-stage companies with aggressive growth mandates.
Percentage should correspond to growth targets and competitive intensity.
Red flags:
Marketing percentage far outside industry norms without strategic justification.
Percentage increasing while growth decelerates (inefficiency).
Inability to articulate why current marketing investment level is appropriate for business stage and goals.
Growth & Scaling Indicators
These KPIs reveal whether marketing contributes to scalable, sustainable growth.
Pipeline Velocity
What it measures:
Speed at which opportunities move through the sales pipeline from creation to close.
Why CEOs care:
Faster pipeline velocity means the business can convert pipeline to revenue more quickly, improving cash flow and reducing sales infrastructure requirements.
Marketing influences velocity through lead quality, nurture effectiveness, and sales enablement.
How to calculate:
Average days from opportunity creation to closed-won.
Track by segment, deal size, or lead source to identify patterns.
What good looks like:
Pipeline velocity improving or stable.
Marketing-sourced opportunities move as fast or faster than sales-sourced (indicating quality).
Velocity predictable enough to forecast revenue timing accurately.
Red flags:
Velocity slowing without explanation (product issues, competitive pressures, weak sales execution).
Marketing-sourced deals taking significantly longer than sales-sourced (poor lead quality or qualification).
Inability to measure velocity (poor CRM hygiene or tracking).
Win Rate
What it measures:
Percentage of opportunities that close as customers versus those lost to competitors or “no decision.”
Why CEOs care:
Win rates reveal product-market fit, competitive positioning strength, and sales effectiveness. Marketing impacts win rates through lead quality (better-fit prospects), positioning (clearer differentiation), and sales enablement (better competitive battle cards, ROI calculators, case studies).
How to calculate:
(Closed-won opportunities ÷ total closed opportunities) × 100 = win rate.
Exclude “still open” opportunities from denominator.
What good looks like:
25-35% win rates for competitive B2B markets. 40-50%+ for strong product-market fit with clear differentiation.
Win rates stable or improving.
Marketing-sourced opportunities have comparable or better win rates than sales-sourced.
Red flags:
Win rates declining (competitive pressure or weakening value proposition).
Marketing-sourced opportunities have significantly lower win rates (poor targeting or qualification).
Loss analysis shows consistent patterns (pricing issues, missing features, weak positioning) that marketing should address.
Sales Cycle Length
What it measures:
Average time from first customer contact to closed deal.
Why CEOs care:
Shorter sales cycles accelerate revenue, reduce cost of sales, and improve cash flow. Marketing influences cycle length through lead quality, pre-sales education (content that answers questions before sales engagement), and competitive positioning.
How to calculate:
Average days from lead creation to closed-won.
Track by segment, deal size, lead source, or product line.
What good looks like:
Sales cycle length stable or shortening.
Predictable enough for accurate revenue forecasting.
Marketing initiatives designed specifically to reduce cycle length (better qualification reducing time wasted on poor-fit prospects, content addressing common objections).
Red flags:
Sales cycles lengthening without strategic explanation (moving upmarket, selling to enterprise). Marketing-sourced deals taking significantly longer than average (poor lead quality or education).
Inability to track or explain cycle length variations.
Channel Performance by Revenue
What it measures:
Revenue attributed to each marketing channel, not just lead volume or pipeline contribution.
Why CEOs care:
Ultimate channel success is measured by closed revenue, not intermediary metrics.
Some channels generate high lead volume but poor conversion; others generate fewer leads that convert at dramatically higher rates.
Revenue-by-channel reveals true ROI.
How to calculate:
Sum closed revenue by first-touch or multi-touch attribution model showing channel contribution.
Track in CRM with proper attribution tagging.
What good looks like:
2-3 channels driving majority of revenue (80/20 principle).
Revenue by channel aligns with budget allocation (highest investment in highest-return channels).
Clear understanding of why certain channels outperform for revenue, not just lead generation.
Red flags:
Revenue attribution disconnected from lead source attribution (suggests attribution model problems or poor lead quality from certain channels).
Continued investment in channels producing leads but not revenue.
Inability to track revenue by channel (broken attribution or CRM implementation).

Startup-Specific Marketing KPIs
Marketing metrics vary significantly by company stage and maturity.
Pre-PMF Metrics (Under $1M-$2M Revenue)
Focus:
Validation, not scale.
CEOs should track qualitative indicators and early efficiency signals rather than mature marketing KPIs.
Key metrics:
- Customer retention rate: Are customers renewing/continuing to use the product? Retention below 70-80% annually signals product issues marketing can’t solve.
- Customer feedback and NPS: Are customers achieving value and willing to recommend? Early champions indicate product-market fit foundations.
- Channel experiments: Which early channels (founder network, content, early ads) show any signal of working? Don’t expect efficiency yet-look for proof of concept.
- Time to value: How long does it take new customers to achieve first meaningful outcome? Marketing influences through onboarding messaging and expectation-setting.
What to avoid:
Obsessing over CAC or scaling metrics before proving customers want the product and will retain.
Series A Metrics ($2M-$10M Revenue)
Focus:
Proving repeatable, scalable customer acquisition and improving unit economics.
Key metrics:
CAC trend: Is customer acquisition cost stable or declining as marketing matures? Early-stage volatility is normal, but trajectory should trend toward efficiency.
CAC payback period: Target under 18 months, ideally under 12. Demonstrates capital efficiency critical for next funding round.
Marketing-sourced pipeline percentage:
- Should be growing from 15-20% toward 40-50% as marketing capabilities build.
- Shows marketing is creating independent pipeline, not just supporting sales.
LTV:CAC ratio:
Target 3:1 minimum.
Investors scrutinize this ratio heavily during Series B fundraising-proves business model sustainability.
Channel validation:
Which 2-3 channels show repeatable, scalable performance?
Series A stage is about finding what works consistently, not running every channel.
What to avoid:
Premature optimization before finding product-market fit.
Over-indexing on brand awareness when direct-response customer acquisition should be priority.
SaaS-Specific Metrics
Focus: Subscription economics and recurring revenue health.
Key metrics:
Monthly Recurring Revenue (MRR) growth:
Core SaaS metric showing subscription revenue trajectory.
Net Revenue Retention (NRR):
Percentage of revenue retained from existing customers including expansion minus churn.
Above 100% means expansion exceeds churn-very healthy.
Marketing impacts through lifecycle campaigns driving usage, upsells, and reducing churn.
Trial-to-paid conversion rate:
For product-led growth SaaS, what percentage of trial users convert to paying customers? Marketing influences through onboarding messaging, in-product prompts, and email nurture.
Logo churn vs revenue churn:
Are you losing small customers (logo churn) but expanding large customers (negative revenue churn)?
Marketing should focus on acquiring customers who match your high-LTV profile.
Customer Acquisition Cost by segment:
Acquisition costs often vary 5-10x between SMB, mid-market, and enterprise.
CEOs should know which segments deliver best unit economics.
For startup-specific guidance and stage-appropriate strategies, see fractional CMO for startups.
Vanity Metrics CEOs Should Ignore
While it’s important to know marketing KPIs every CEO should track, it’s equally important to understand which metrics to avoid.
Certain metrics create the illusion of progress without business impact.
Traffic Without Revenue
Why it’s misleading:
Website traffic sounds impressive-“we had 50,000 visitors last month!”.
But this means nothing if visitors don’t convert to leads, opportunities, or customers.
High traffic with poor conversion indicates targeting the wrong audience or weak messaging/offering.
What to do instead:
Track visitor-to-lead conversion rate and visitor-to-customer rate.
10,000 visitors with 5% lead conversion and 2% eventual customer conversion (200 customers) is far better than 100,000 visitors with 0.5% lead conversion and 0.1% customer conversion (100 customers).
Social Engagement
Why it’s misleading:
Likes, shares, comments, and followers don’t pay bills.
Social engagement can be manufactured or represent audiences that will never buy.
B2B companies especially should question whether social metrics correlate with pipeline or revenue.
What to do instead:
Track social-sourced pipeline or revenue.
If social media generates zero pipeline despite thousands of engaged followers, it’s consuming resources without business impact.
Either optimize social for pipeline generation or reduce investment.
Raw Impressions
Why it’s misleading:
Ad impressions measure how many times your ad was displayed-not whether anyone cared, clicked, or converted.
Optimizing for impressions can lead to cheap but irrelevant placements that don’t reach target customers.
What to do instead:
Track impression-to-click rate and click-to-conversion rate.
Fewer impressions reaching the right audience with strong conversion is always superior to massive impressions with no business outcome.
MQL Volume Without Pipeline Impact
Why it’s misleading:
Marketing Qualified Leads (MQLs) are often defined by arbitrary criteria (downloaded whitepaper, attended webinar, filled out form) that don’t predict sales readiness or likelihood to buy.
High MQL volume can flood sales with unqualified leads, wasting sales time and creating marketing-sales friction.
What to do instead:
Track MQL-to-SQL conversion rate and MQL-to-customer rate.
If only 5% of MQLs become sales-qualified leads, the qualification criteria are broken.
Better to generate fewer, higher-quality leads that sales can actually close.

What a CEO Marketing Dashboard Should Include
Executive dashboards should be layered by review frequency and strategic importance.
Weekly Snapshot (5-Minute Review)
Purpose: Spot emerging issues requiring immediate attention.
Metrics to include:
- Pipeline created this week (dollar value, not lead count)
- Week-over-week pipeline change (trend direction)
- CAC estimate for current period (is cost per customer trending up or down?)
- Marketing-sourced opportunities in active sales cycles
- Critical conversion rates (visitor-to-lead if volume-dependent, or MQL-to-SQL if lead quality is focus)
Format:
Single-page summary or dashboard accessible on phone.
Should take 5 minutes to review and flag anything needing CEO attention.
Monthly Strategic Metrics (30-Minute Review)
Purpose: Assess whether marketing is on track to hit quarterly and annual goals.
Metrics to include:
- CAC trend over the past 6 months (improving, stable, or deteriorating?)
- LTV:CAC ratio and trend (are unit economics improving?)
- Marketing-sourced revenue month-to-date and percentage of total
- Pipeline coverage ratio (pipeline value ÷ revenue target, accounting for win rates and sales cycle length-typically need 3-4x pipeline to hit revenue targets)
- Channel performance by revenue and CAC (which channels are working?)
- Marketing spend actuals vs. budget
- Key conversion rates by stage with month-over-month comparison
- Win rates and sales cycle length trends
Format:
Structured monthly meeting with CMO or fractional CMO reviewing dashboard, explaining variances, and discussing corrective actions for underperformance.
Quarterly Board Metrics (60-Minute Preparation)
Purpose:
Communicate marketing’s contribution to growth, demonstrate efficient capital deployment, and justify continued or increased marketing investment to board and investors.
Metrics to include:
- Revenue growth rate and marketing’s attributed contribution
- CAC trend over past 12 months with forward projections
- LTV:CAC ratio and components (LTV increasing or CAC decreasing?)
- CAC payback period trend
- Marketing efficiency ratio (MER)
- Pipeline contribution as percentage of total pipeline
- Win rate trends and competitive positioning insights
- Channel performance summary showing ROI by source
- Marketing spend as % of revenue with benchmarking context
- Key initiatives launched and early results
- Next quarter priorities and expected impact
Format:
Board presentation with clear narrative connecting marketing metrics to business outcomes.
Focus on trends (not point-in-time numbers), explanations for variance, and future outlook.
Suggested Read: fractional CMO responsibilities and fractional CMO services.
How a Fractional CMO Aligns Marketing KPIs to Revenue
A fractional CMO creates accountability frameworks connecting marketing activity to business outcomes.
They implement revenue-centric measurement by:
- Establishing baseline KPIs and attribution models showing current state
- Defining target metrics aligned with revenue goals and growth stage
- Implementing dashboard infrastructure providing real-time visibility into performance
- Creating weekly/monthly reporting cadence ensuring consistent monitoring
- Holding marketing teams accountable to business outcomes rather than activity metrics
It takes around 60-90 days to start seeing results:
- CAC becomes trackable by channel and cohort where previously it was approximated or unknown
- Pipeline contribution attribution shifts from estimates to data-driven measurements
- Conversion rate improvements identify specific optimization opportunities (leading to 10-25% efficiency gains)
- Executive dashboards replace marketing activity reports with business-impact summaries investors and boards understand
This revenue alignment is one of the key differences between strategic marketing leadership and tactical marketing management.
Fractional CMOs ensure every dollar spent and every initiative launched connects clearly to customer acquisition efficiency, pipeline growth, or revenue contribution.
Check out fractional cmo studies to get a better idea.

FAQs About CEO Marketing KPIs
What is the most important marketing KPI for a CEO?
The single most important KPI is the CAC trend, whether customer acquisition cost is rising, stable, or falling over time.
CAC encapsulates marketing and sales efficiency, reflects product-market fit and competitive positioning, and directly determines whether the business model is sustainable.
A company with rising CAC and stagnant LTV is on a path to unprofitability.
And a business with declining CAC and growing LTV has discovered scalable, efficient growth.
CEOs should monitor CAC monthly and understand what’s driving changes (channel mix shifts, competitive intensity, targeting changes, conversion improvements, or seasonal factors).
How often should a CEO review marketing metrics?
Weekly reviews for pipeline health and early warning signals (5 minutes scanning dashboard).
Monthly strategic reviews examining trends, explaining variances, and making course-correction decisions (30-60 minutes with CMO or fractional CMO).
Quarterly deep dives preparing board reporting and assessing whether marketing investments are delivering expected returns (60-90 minutes).
This layered approach provides appropriate oversight without micromanaging tactical execution.
CEOs who review marketing metrics only quarterly miss opportunities to correct underperformance early.
And those who review daily waste time on tactical fluctuations that don’t require executive attention.
Should CEOs track MQLs?
Not directly.
MQL volume is a marketing operations metric that doesn’t tell CEOs whether marketing is working.
What CEOs should track is MQL-to-SQL conversion rate and MQL-to-customer conversion rate.
These metrics tell whether marketing’s qualification criteria are meaningful or arbitrary.
If 50% of MQLs become sales-qualified, marketing is generating quality leads worth sales time. If only 5% qualify, the MQL definition is broken and marketing is wasting sales resources.
Focus on quality and conversion, not volume.
How do marketing KPIs for CEOs differ by company stage?
Pre-PMF companies (under $2M revenue) should focus on retention, customer feedback, and early validation.
This is not the time to worry about CAC or scaling metrics yet.
Series A companies ($2M-$10M) should obsess over proving unit economics (CAC, LTV, payback period) and demonstrating repeatable customer acquisition to support Series B fundraising.
Growth-stage companies ($10M-$50M) optimize for efficiency, predictability, and capital deployment while scaling proven channels.
Mature companies ($50M+) balance efficiency, market share defense, and long-term brand building.
Tracking identical KPIs across all stages leads to misaligned priorities.
Early-stage companies waste time optimizing CAC before finding product-market fit, while mature companies under-invest in brand assuming only direct-response matters.
Closing Thought: Marketing KPIs Every CEO Should Track
CEOs don’t need to become marketing experts.
However, they need to know which metrics separate signal from noise and demand accountability for business outcomes.
The best marketing dashboards answer three questions in under 5 minutes:
- Is marketing acquiring customers at sustainable cost?
- Is marketing contributing predictably to revenue?
- Are unit economics improving or deteriorating?
Everything else is operational detail marketing teams should optimize but CEOs should trust without micromanaging.
The shift from activity-based to outcome-based marketing measurement transforms organizational performance.
- Marketing teams stop gaming vanity metrics and start solving real business problems.
- Budget allocation follows ROI rather than politics or inertia
- Conversations between CEO and CMO focus on strategic challenges (market positioning, competitive dynamics, growth constraints) rather than tactical reporting
Establishing the right KPIs isn’t about building elaborate dashboards.
The goal is to create clarity on what success looks like and ensure everyone optimizes for the same outcomes.

Shashank brings over 22 years of global omnichannel marketing experience. As a 4x Chief Marketing Officer, he has helped several organizations (Startups and Fortune 500) drive sustainable revenue growth through strategic marketing.