
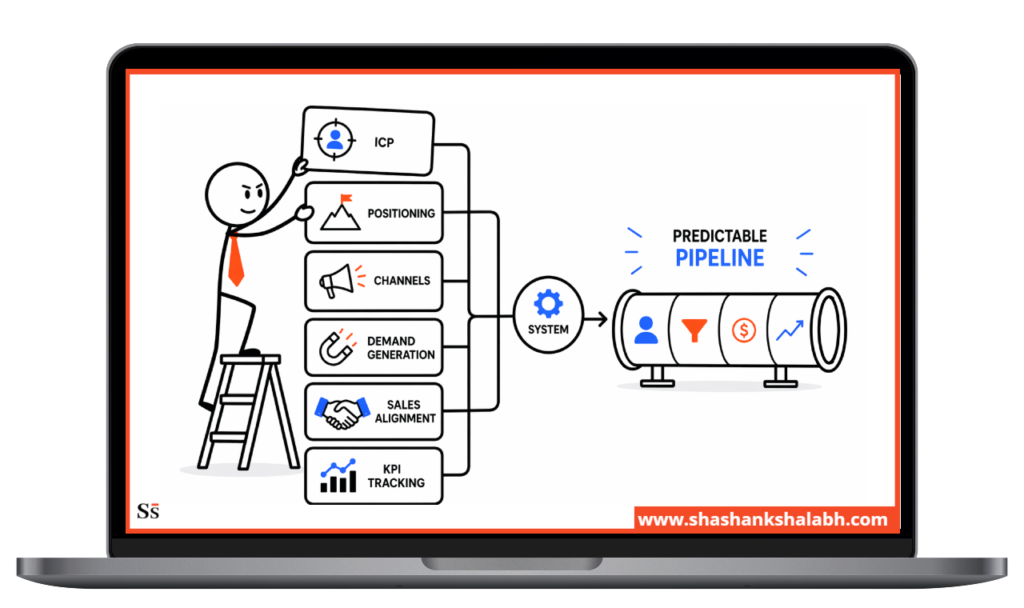
A B2B go-to-market template helps you build a predictable pipeline from scratch.
This template comprises six key components, namely, ICP definition, positioning and messaging, channel prioritization, demand generation architecture, sales-marketing alignment, and KPI tracking.
This approach comes from fractional CMO Shashank Shalabh’s 22 years of marketing experience, helping 20+ growth-stage companies across SaaS, fintech, e-commerce, and professional services.
This B2B go-to-market template is built for businesses between $2M-$50M revenue that have proven product-market fit and need to build systematic, repeatable pipeline.
The six components of B2B GTM template:
- ICP definition: who you’re targeting and why
- Positioning and messaging: how you differentiate and what you say
- Channel prioritization: where you invest and how you allocate budget
- Demand generation architecture: how you build and run pipeline programs
- Sales-marketing alignment: how you connect marketing to revenue
- KPI framework: how you measure whether the system is working
What a B2B GTM Template Should Include
Most B2B companies confuse a GTM strategy with a marketing plan.
A marketing plan is about what you’ll do: campaigns, channels, and tactics.
A GTM strategy is the system those efforts run inside. For example, who you’re targeting, how you’re positioned, how revenue is owned, and how success is measured.
If you use tactics without a clear strategy, you will see inconsistent results. You can run strong paid campaigns against the wrong audience and watch CAC rise.
Likewise, if you create great content with weak positioning, you will end up with a pipeline that doesn’t convert.
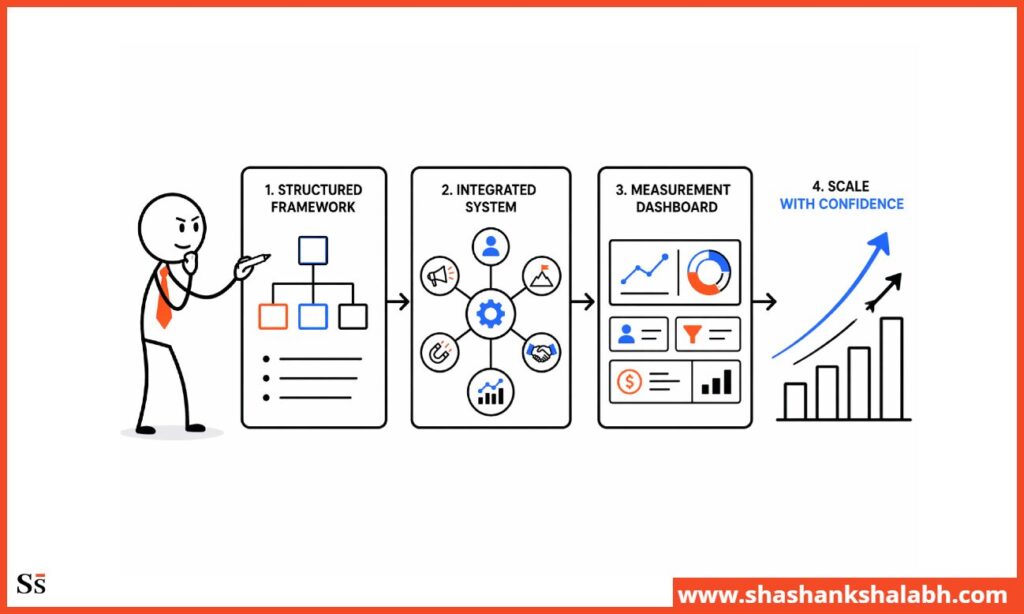
Three principles before building a B2B GTM template:
Structure before tactics. Define ICP and positioning before selecting channels. Channels are distribution mechanisms for a message.
If the message is wrong, the channel doesn’t matter.
Integration before optimization. Get all six components working together before optimizing any one of them.
A well-optimized demand generation program with misaligned sales will underperform a moderate program where sales and marketing are aligned.
Fix alignment first. Optimize second.
Measurement before scaling. Establish the KPI framework before increasing spend. Scaling a system you can’t measure produces faster spending on problems you can’t diagnose.
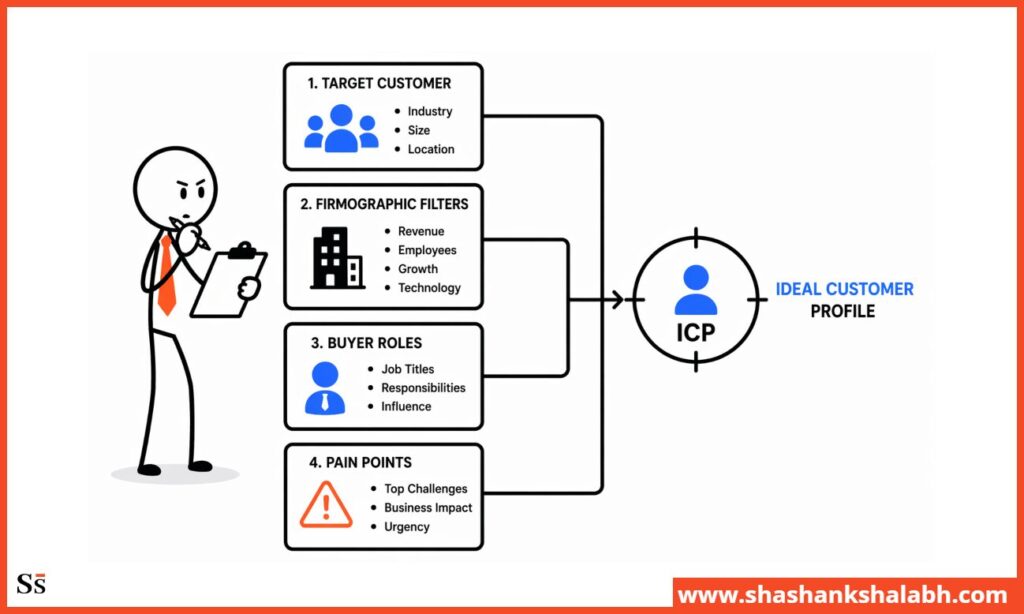
Section 1 B2B GTM Template: ICP Definition
Your ideal customer profile (ICP) is the foundation of your GTM system.
Every part of your strategy depends on it.
When ICP is unclear, acquisition costs rise, conversion rates fall, retention suffers, and your message misses the mark.
And when you have a clear ICP, you lower acquisition costs, increase conversion rates, shorten sales cycles, and win customers who stay and grow.
Firmographic Criteria
Define the company characteristics that make a prospect a strong fit.
These should be based on closed-won data. Do not make assumptions about who the company wants to sell to.
Template:
| Firmographic | Definition | Source |
| Company size (employees) | e.g. 50-500 | Closed-won analysis |
| Revenue range | e.g. $5M-$50M | Closed-won analysis |
| Industry / vertical | e.g. B2B SaaS, professional services | Win rate by vertical |
| Geography | e.g. US, English-speaking markets | Closed-won analysis |
| Funding stage | e.g. Series A-C, PE-backed | Deal history |
| Technology markers | e.g. Salesforce CRM, HubSpot | Tool stack data |
The firmographic criteria define who to target. Build this from the customers who converted fastest, paid reliably, and retained longest.
Buyer Roles and Decision-Making Structure
Define who is involved in the buying decision, and what each role cares about.
Template:
| Role | Title examples | Primary concern | Objection pattern |
| Economic buyer | CEO, CFO, COO | ROI, risk, payback period | “Is this worth the investment?” |
| Champion | VP Marketing, CMO | Functional outcome, career risk | “Will this work in our environment?” |
| Influencer | Marketing Director, Ops Lead | Ease of implementation, team impact | “How much work is this for my team?” |
| Blocker | IT, Legal, Procurement | Risk, compliance, vendor standards | “Does this meet our requirements?” |
Write messaging for the economic buyer. Give sales the tools to address the champion’s concerns. Build the deal process to handle blockers before they appear late.
Pain Points and Buying Triggers
Define the specific problems the ICP is experiencing, and the events that trigger them to look for a solution.
Pain points template:
- Primary pain: the problem the product solves directly
- Secondary pain: the organizational consequences of the primary pain
- Status quo pain: the cost of not solving it
Buying trigger template:
- Event-based triggers: funding close, leadership change, missed revenue target, new competitive threat
- Milestone-based triggers: team growth past a threshold, product launch, market expansion
- Frustration-based triggers: current solution failing, team capacity hit, board pressure escalating
Why triggers matter
Timing determines conversion.
A company with the right ICP but no active trigger will engage slowly.
And a business with the right ICP and an active trigger will move fast.
Demand generation programs that reach ICP prospects at trigger moments produce the fastest pipeline velocity.
Disqualification Criteria
Define who is NOT a fit, explicitly. This is as important as defining who is.
Disqualification template:
- Revenue below threshold (e.g. under $5M ARR; insufficient budget for the engagement)
- Wrong buying structure (e.g. requires committee approval of over 10 stakeholders; cycle too long)
- Wrong tech stack (e.g. requires legacy ERP integration the product doesn’t support)
- Wrong culture fit (e.g. organizations that want execution only, not strategic leadership)
Disqualification criteria save sales time, improve conversion rates, and lower CAC. The tighter the ICP, the more efficient the GTM system.
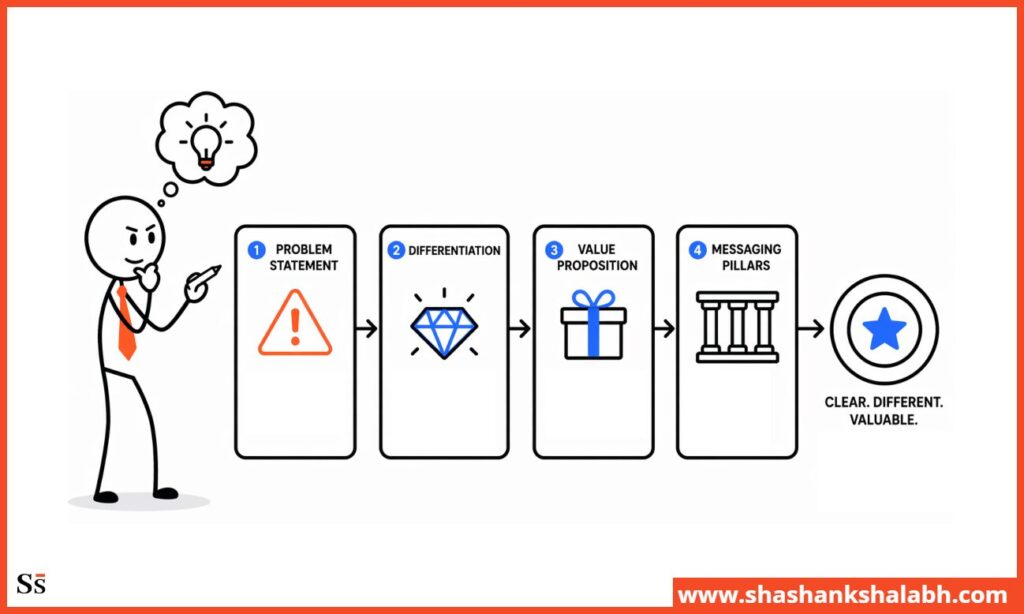
Section 2 B2B GTM Template: Positioning and Messaging Framework
Positioning defines the place your company holds in the market. Messaging is how you communicate that position to buyers.
They are related but not the same. Weak positioning cannot be fixed with better messaging. Strong positioning makes messaging clear, credible, and easier to execute.
Problem Statement
Define the problem the company solves. This should be from the buyer’s perspective, not the product’s perspective.
Template:
“[ICP] struggle with [specific problem] because [root cause]. The consequence is [business impact]. Current solutions [why they fall short].”
Example:
“Series B SaaS companies struggle with inconsistent pipeline because their marketing function lacks executive-level strategic direction. This results in missed growth targets and board pressure. Agencies and marketing managers execute tactics without owning revenue outcomes.”
The problem statement grounds every messaging decision that follows.
If the message doesn’t connect back to this problem, it doesn’t belong in the GTM system.
Differentiation Framework
Define what makes the company’s solution genuinely different, not just better.
Template:
| Differentiation dimension | Our position | Competitor A | Competitor B |
| Engagement model | Direct operator, personal accountability | Firm model, matched CMO | Agency execution, no strategy |
| Revenue ownership | Owns pipeline and CAC outcomes | Depends on individual | Activity-based deliverables |
| Speed to impact | Day 1-30 diagnostic | 60-90 day ramp | Campaign-by-campaign |
| Cost | $15K-$25K/month | Higher with firm overhead | Variable, often higher per outcome |
Differentiation should match the ICP’s buying criteria.
What does the economic buyer evaluate when comparing options?
Build your differentiation around those criteria, not around features the company thinks are impressive.
Value Proposition
Translate differentiation into buyer language. State the value in clear outcomes the buyer cares about.
Template:
“[Company] helps [ICP] achieve [primary outcome] by [mechanism], without [key objection or tradeoff].”
Example: “A fractional CMO helps Series A and B SaaS companies build predictable pipeline and improve CAC by 20-35% through executive marketing leadership directly, without the $300K-$700K cost of a full-time hire.”
The value proposition should pass the “so what?” test.
Read it out loud. If a prospect could reasonably respond “so what?”, it’s not specific enough.
Messaging Pillars
Define three to four core messages that support the value proposition.
These are the ideas that repeat across all channels, all content, and all sales conversations.
Template:
| Pillar | Core message | Supporting proof |
| Pillar 1: Revenue accountability | Marketing should own pipeline outcomes, not just activity metrics | KPI framework, board reporting model |
| Pillar 2: Executive capability | Fractional CMO = CMO-level thinking, not senior marketer doing part-time work | Case studies, diagnostic process |
| Pillar 3: Capital efficiency | $15K-$25K/month vs $300K-$700K full-time; same capability, fraction of the cost | Cost comparison data |
| Pillar 4: Speed | Day 30 diagnostic, Day 90 pipeline improvement; not a 6-month ramp | 90-day framework, pipeline benchmarks |
Each pillar should connect to a buyer’s concern.
Pillar 1 addresses the board’s concern about marketing accountability.
And pillar 2 handles skepticism about fractional quality. Pillar 3 addresses cost objections and pillar 4 takes care of urgency.
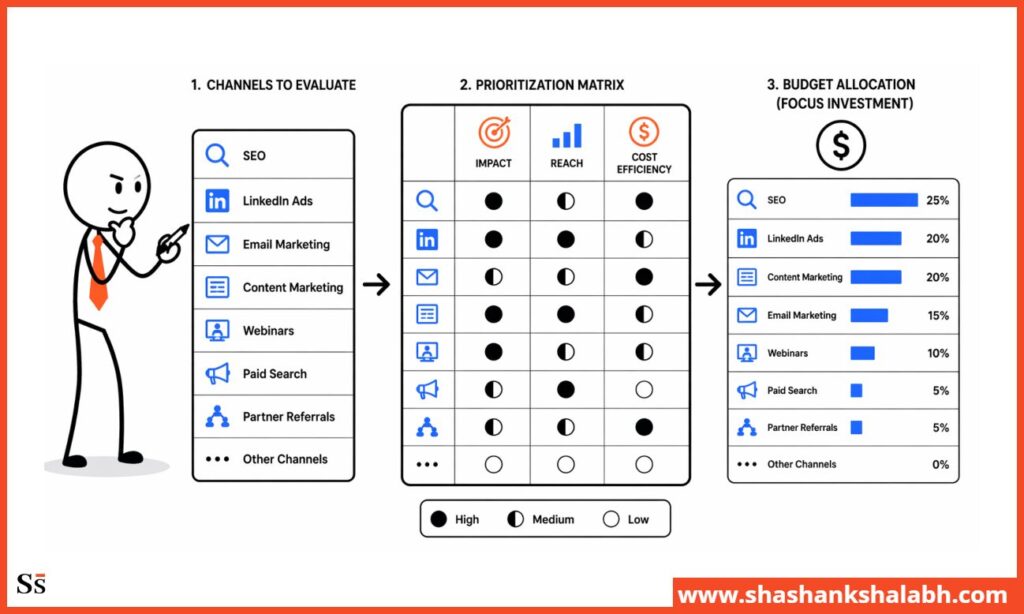
Section 3 B2B GTM Template: Channel Prioritization Matrix
Channel selection is one of the most important GTM decisions. It is also one of the most frequently made incorrectly.
I have seen that businesses pick channels based on what the team knows or what worked at a previous company.
The right way to choose channels is based on ICP fit, CAC efficiency, and scalability for the specific business.
Channel Evaluation Criteria
Evaluate each channel against four criteria before committing a budget.
Template:
| Criterion | Definition | Question to answer |
| ICP reach | Does this channel efficiently reach the defined ICP? | Where does the ICP spend their attention? |
| CAC efficiency | What is the cost per acquired customer through this channel? | What is the CAC payback period at current spend? |
| Scalability | Can this channel produce more pipeline with more investment? | Does performance improve or plateau as spend increases? |
| Time to pipeline | How long from investment to measurable pipeline? | What is the lag between spend and first qualified opportunity? |
Channel Prioritization Matrix
Template: Rate each channel 1-5 on each criterion:
| Channel | ICP Reach | CAC Efficiency | Scalability | Time to Pipeline | Total Score |
| Organic search (SEO) | 4 | 5 | 4 | 2 (slow to build) | 15 |
| Paid search | 4 | 3 | 4 | 5 (fast) | 16 |
| LinkedIn paid | 3 | 2 | 4 | 4 | 13 |
| Content + email nurture | 5 | 5 | 3 | 2 (slow to build) | 15 |
| Outbound (targeted) | 4 | 4 | 3 | 4 | 15 |
| Events / speaking | 3 | 2 | 2 | 3 | 10 |
| Partner / referral | 5 | 5 | 2 | 3 | 15 |
How to use this matrix:
Allocate the primary budget to the highest-scoring channel.
Deprioritize channels scoring below 12, unless they serve a specific strategic purpose such as brand, partnership, or market presence.
Budget Allocation Framework
Once you prioritize channels, allocate budget based on channel score and stage of development.
Budget allocation principles:
- Put 60-70% of your demand generation budget into two core channels. Go deeper, not wider.
- Assign 20-30% to the next strongest channel you are actively building.
- Hold back 10% for testing. Use it for new channels that do not yet have enough data to score.
For B2B SaaS companies in the growth stage, marketing spend averages 20-35% of revenue.
Once a company passes $30M in ARR, that percentage usually drops as channels mature and customer acquisition costs (CAC) improve.
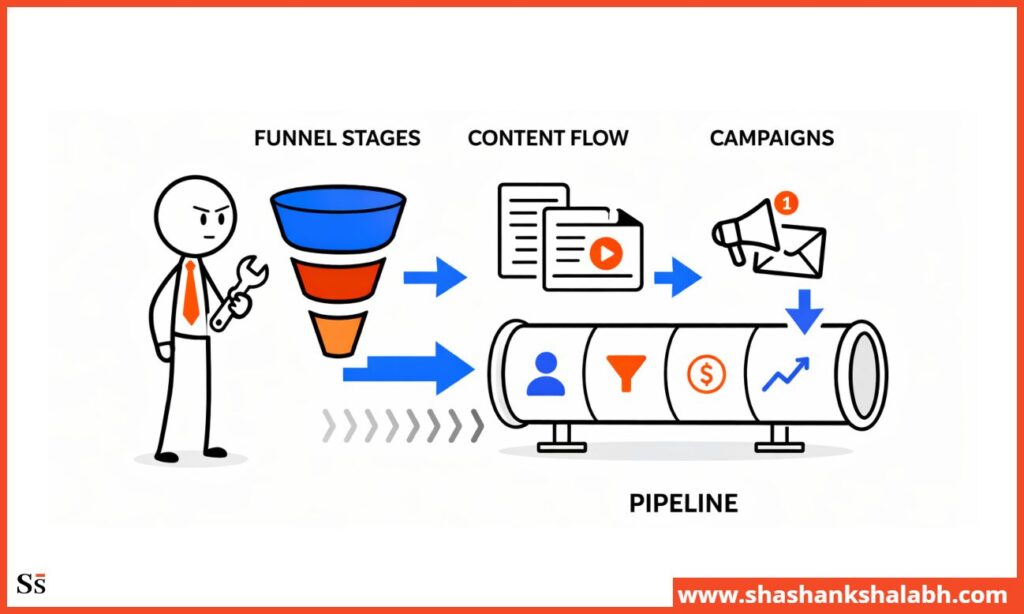
Section 4 B2B GTM Template: Demand Generation
Demand generation architecture is the system that consistently produces pipeline.
It defines how campaigns are built, how the funnel is managed, and how leads move from first touch to qualified opportunity.
Funnel Stage Definitions
Define each stage of the funnel, with specific criteria, not vague descriptions.
Template:
| Stage | Definition | Criteria to advance | Owner |
| Awareness | Prospect aware of company | Visited website, consumed content | Marketing |
| Interest | Prospect engaging with problem-solution content | Downloaded resource, attended webinar | Marketing |
| MQL | Marketing-qualified lead | Meets ICP firmographic criteria + engagement threshold | Marketing |
| SQL | Sales-qualified lead | Confirmed budget, authority, need, timeline | Sales |
| Opportunity | Active sales process | Discovery call completed, proposal stage | Sales |
| Closed-won | Customer | Contract signed | Sales |
The MQL definition is the most important line in your funnel.
If marketing and sales do not agree on what counts as an MQL, your pipeline data becomes unreliable.
Define it clearly with specific criteria, and get written agreement from both teams before you build any demand generation programs.
Content Strategy by Funnel Stage
Content should serve the buyer’s journey.
Template:
| Funnel stage | Buyer question | Content type | Goal |
| Awareness | “Do I have this problem?” | Blog, social, podcast, speaking | Create problem recognition |
| Interest | “What are the solutions?” | Guides, comparison content, webinars | Build solution awareness |
| MQL | “Is this the right solution?” | Case studies, frameworks, assessments | Build category preference |
| SQL | “Why this company?” | ROI calculators, detailed case studies, proposals | Enable decision |
| Closed-won | “How do I succeed?” | Onboarding content, implementation guides | Drive retention |
Each content type serves a specific buyer question.
Content built without this mapping fills a content calendar without moving buyers through the funnel.
Campaign Structure
Build campaign structure around ICP buying triggers.
Campaign structure template:
- Trigger: What buyer event or condition activates this campaign?
- ICP segment: Which specific ICP subset is this campaign targeting?
- Message: Which positioning pillar does this campaign lead with?
- Channel: Which channel reaches this ICP segment most efficiently?
- CTA: What is the next step for a qualified prospect?
- Success metric: What KPI determines whether this campaign is working?
Think of it like this. A business running five campaigns without this structure is running five activities.
And an organization running five campaigns with this structure is running a demand generation system.
Pipeline Flow and Handoff
Define how the pipeline flows from marketing to sales, and what happens at each handoff point.
Handoff protocol template:
When a prospect reaches MQL status:
- Marketing passes the MQL to sales within 24 hours
- Sales receives the ICP criteria score, engagement history, and recommended outreach approach
- Sales follows up within the defined SLA: 24 hours for high-score MQLs, 48 hours for standard MQLs
- If the MQL doesn’t meet SQL criteria after initial outreach, it returns to marketing nurture with a documented reason
- That reason is used to refine the ICP and improve the MQL definition over time.
The handoff protocol is the mechanism that makes sales-marketing alignment operational.
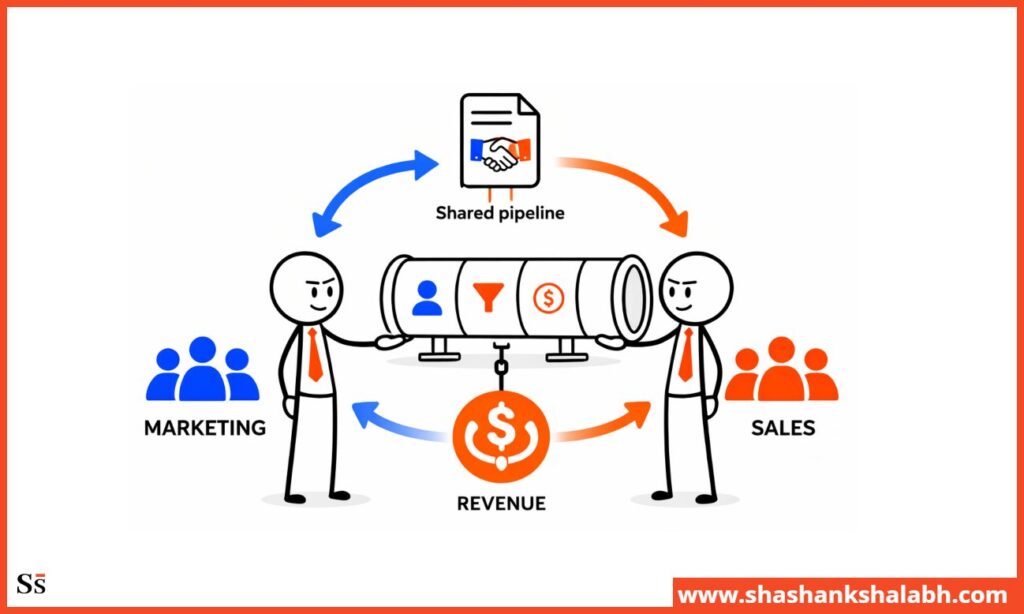
Section 5: Sales-Marketing Alignment Protocol
Sales-marketing misalignment is one of the most expensive problems in a B2B GTM system.
It produces high-volume, low-quality pipelines, wasted sales time, unreliable forecasts, and organizational friction.
Businesses with strong alignment grow 50-80% faster than those without it.
Shared Pipeline Definitions
Both teams must operate from the same definitions. If marketing defines an MQL differently than sales qualifies one, every pipeline metric is unreliable.
Alignment checklist:
- MQL definition: documented, specific, agreed in writing by both teams
- SQL definition: documented, specific, agreed in writing by both teams
- Opportunity definition: first meeting completed, or something more specific?
- Closed-lost reasons: documented categories, not free-text fields
- Pipeline stage exit criteria: what must be true for a deal to advance?
Lead Qualification Standards
Define what information marketing provides at handoff, and what sales commits to doing with it.
Marketing’s commitment at MQL handoff:
- ICP fit score: firmographic criteria met, scored 1-10
- Engagement summary: what content consumed, what pages visited, what events attended
- Buying trigger identified (if known)
- Recommended outreach approach, based on engagement pattern
Sales’ commitment at MQL receipt:
- Follow-up within defined SLA: 24 or 48 hours based on score
- Document outcome in CRM: contacted, not reached, disqualified (with reason)
- Provide feedback on lead quality: weekly, in a documented format
Feedback Loops
Feedback loops are how the GTM system improves.
Without them, marketing generates volume and sales qualifies it with no information flowing back to improve targeting.
Weekly feedback loop:
Sales reports: how many MQLs contacted, how many converted to SQL, top reasons for disqualification
Marketing reviews: disqualification reasons, adjusts ICP criteria or targeting if patterns emerge
Monthly feedback loop:
Joint pipeline review: marketing and sales review pipeline quality together.
Which channels are producing the best SQL conversion, where are deals stalling, what messaging is working in sales conversations
Quarterly feedback loop:
Win/loss analysis: marketing and sales review closed-won and closed-lost deals together.
What ICP patterns predict wins, what competitive dynamics are appearing, what positioning is landing in proposals
Revenue Ownership
Revenue accountability shouldn’t stop at the MQL.
Marketing should own a percentage of closed revenue as a primary KPI, and not just pipeline volume.
Revenue ownership template:
| KPI | Owner | Target | Review cadence |
| Pipeline volume | Marketing | 3:1 coverage against target | Monthly |
| Marketing-sourced revenue % | Marketing | 40-60% at growth stage | Quarterly |
| MQL-to-SQL conversion rate | Shared | Defined by funnel benchmarks | Monthly |
| Sales cycle length | Shared | Trend improvement target | Quarterly |
| CAC | Shared | Payback under 12 months | Monthly |
When marketing is accountable for marketing-sourced revenue, the entire demand generation system aligns to revenue outcomes instead of activity metrics.
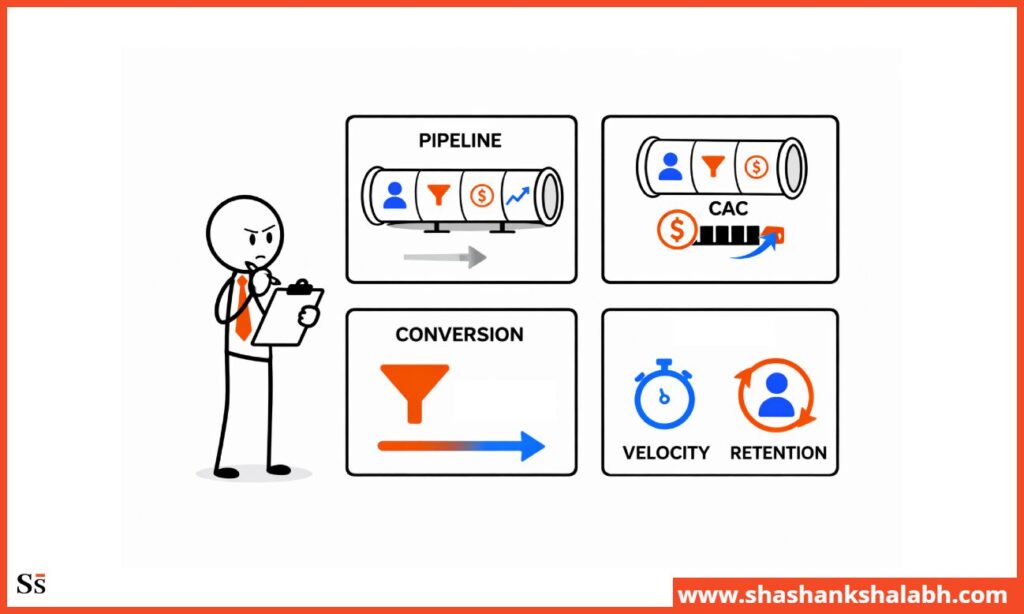
Section 6 B2B GTM Template: KPI Framework
The KPI framework is what makes the GTM system measurable, improvable, and board-reportable.
Without it, the system runs but you can’t tell whether it’s working or why.
Pipeline Metrics
Template:
| Metric | Definition | Target | Frequency |
| Pipeline coverage ratio | Total qualified pipeline / revenue target | 3:1 | Monthly |
| Marketing-sourced pipeline % | Pipeline from marketing / total pipeline | 40-60% (growth stage) | Monthly |
| MQL volume | Total MQLs generated | Set against pipeline coverage target | Monthly |
| MQL-to-SQL conversion rate | SQLs / MQLs | Benchmark from funnel data | Monthly |
CAC and Efficiency Metrics
Template:
| Metric | Definition | Target | Frequency |
| CAC | Total marketing + sales cost / new customers | Payback under 12 months (B2B SaaS) | Monthly |
| CAC by channel | Channel spend / customers sourced by channel | Improving trend | Monthly |
| LTV:CAC ratio | Customer LTV / CAC | 3:1 minimum, 4:1-5:1 target | Quarterly |
| CAC payback period | CAC / monthly revenue per customer | Under 12 months | Quarterly |
Conversion and Velocity Metrics
Template:
| Metric | Definition | Target | Frequency |
| SQL-to-opportunity rate | Opportunities / SQLs | Improving trend | Monthly |
| Opportunity-to-close rate | Closed-won / total opportunities | Improving trend | Monthly |
| Average sales cycle length | Days from SQL to closed-won | Declining trend | Monthly |
| Pipeline velocity | (Opportunities × win rate × deal size) / sales cycle | Increasing trend | Monthly |
Retention and Expansion Metrics
Template:
| Metric | Definition | Target | Frequency |
| Annual retention rate | Customers retained / customers at start of period | 70-80%+ minimum | Quarterly |
| Net revenue retention | (Starting ARR + expansion − churn − contraction) / starting ARR | Above 100% | Quarterly |
| LTV improvement | Change in average customer lifetime value | Improving trend | Quarterly |
Reporting Cadence
Weekly: Marketing team reviews pipeline volume, MQL quality, channel performance. Identifies immediate optimization opportunities.
Monthly: Marketing leadership reviews full KPI dashboard. CAC, pipeline coverage, conversion rates. Prepares board-ready summary. Conducts joint pipeline review with sales.
Quarterly: Full GTM review. Channel performance, budget allocation, ICP refinement, positioning update. Board presentation of marketing metrics.
Annually: Full GTM strategy review. ICP accuracy, positioning validity, channel strategy reset, team structure assessment.
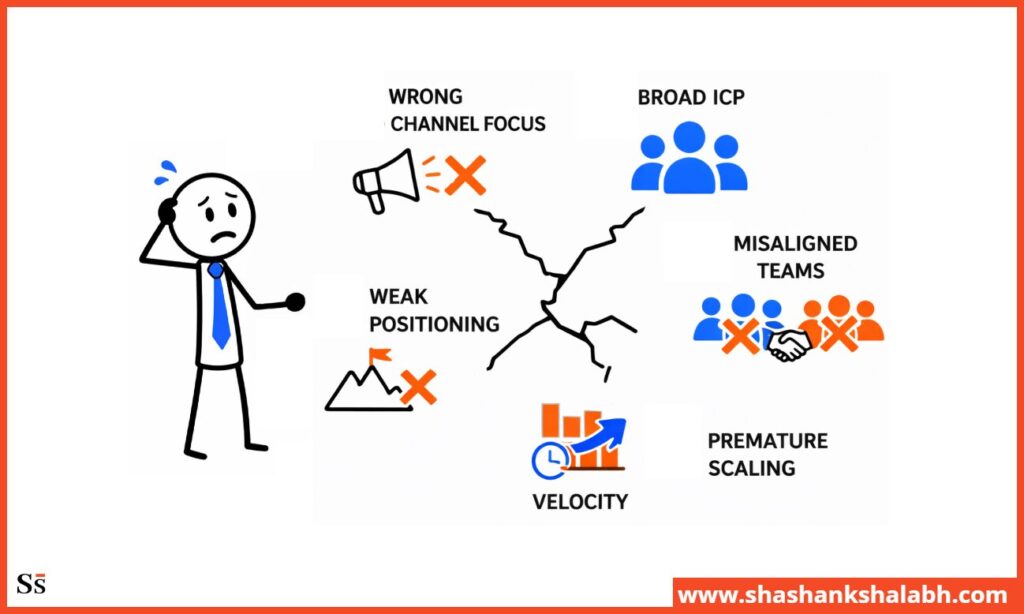
Common Go-To-Market Strategy Mistakes
Even well-intentioned GTM strategies fail for predictable reasons.
Here’s what to avoid.
Channel-First Thinking
Choosing channels before defining ICP and positioning is the most common GTM mistakes.
Channels are just the distribution system. If you are targeting the wrong audience or using the wrong message, the channel will not fix it.
Businesses that jump to “we should do more paid social” or “let’s build SEO” before defining who they are targeting and what they are saying end up optimizing channels around the wrong foundation.
ICP That’s Too Broad
“Mid-market B2B companies” is not an ICP.
It is a market.
An ICP is specific, defined by firmographic patterns from closed won deals, clear buying triggers, and explicit disqualification rules.
Broad ICPs create high volume but low quality pipelines.
They increase CAC because you are reaching too many wrong-fit accounts and converting too few of them.
Positioning That Matches the Competition
When every company in a category uses the same language, such as “we deliver results,” “we’re your strategic partner,” and “we drive growth,” your positioning disappears.
Buyers cannot tell one option from another. Sales cycles get longer. Win rates drop.
Strong positioning requires a clear claim that competitors cannot or will not make, supported by specific proof.
Sales-Marketing Misalignment
Building a strong demand generation system and handing it to a misaligned sales team creates expensive MQLs that do not close.
The problem usually starts with the MQL definition.
Marketing generates leads that match its criteria. Sales rejects them as unqualified.
Both teams then spend time debating instead of improving the system.
Define shared criteria before you build the system.
The handoff protocol only works when both sides design it together.
Scaling Before Measuring
Increasing budget on a GTM system before the KPI framework is established produces faster spending on problems that haven’t been diagnosed.
Businesses that scale paid acquisition before establishing CAC by channel don’t know whether they’re scaling efficient spend or inefficient spend.
Establish the measurement framework first. Scale the spend once the data is reliable enough to guide allocation.’
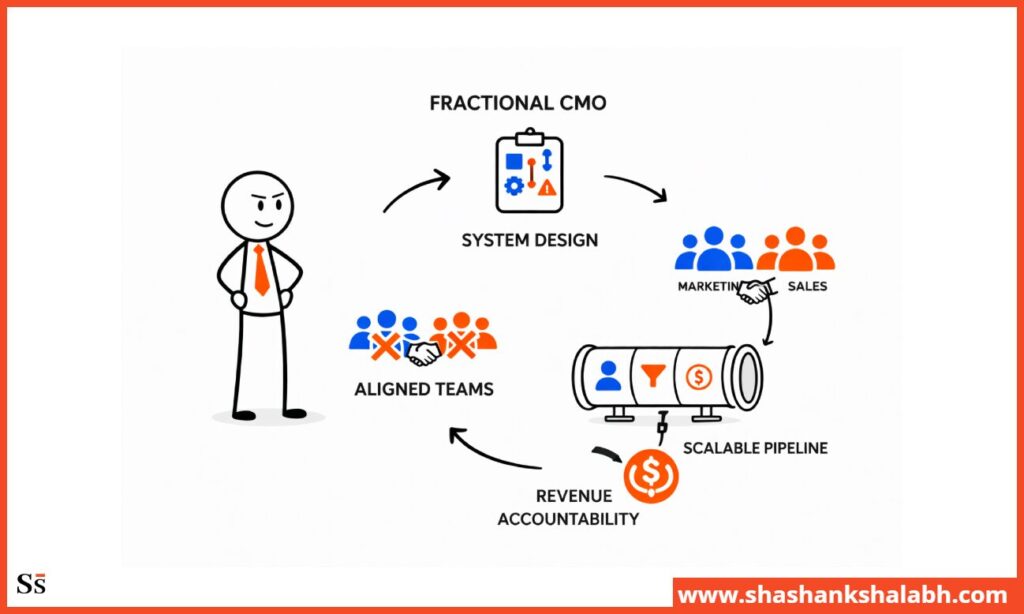
How a Fractional CMO Uses This Framework
A B2B GTM template is just a structure.
Getting it right takes executive judgment.
You have to know when to tighten the ICP, which channels fit the business model, how to set KPI targets that are ambitious but still realistic, and how to align two teams that are often not naturally aligned.
Structuring the GTM System for the Specific Stage
A fractional CMO applies this template to the company’s specific situation, not as a generic framework but as a diagnostic first exercise.
They build the ICP from the company’s closed won data.
They shape positioning around the real competitive environment the company operates in.
And they build the channel matrix using the company’s actual CAC data, not industry benchmarks.
Aligning Marketing and Sales Around Shared Revenue Accountability
The alignment section of this template is where most GTM implementations fail because it requires both teams to agree on definitions and accountability that did not exist before.
A fractional CMO sets these agreements at the executive level, with the CEO and sales leadership involved.
So alignment carries real organizational weight instead of becoming a marketing initiative that sales ignores.
Scaling Pipeline Systematically
Once the GTM system is in place and the KPI framework is running, a fractional CMO scales the pipeline by systematically optimizing channels.
They identify which channels deliver the best CAC efficiency and shift more budget into them.
The fractional CMO also finds out the underperforming channels and either improve them or shut them down.
With a structured demand generation system, pipeline growth of 50-150% is achievable within 6 to 12 months of implementation.
Ensuring Revenue Accountability at Every Stage
A fractional CMO ties every part of this template to revenue outcomes.
They hold the ICP definition accountable to CAC and win rate.
And measure positioning by conversion rates and sales cycle length.
They evaluate channel strategy by CAC by channel and pipeline coverage. And align the KPI framework to the pipeline and revenue targets the board actually reviews.
For more detail on how this framework works, see Go-To-Market Strategy for Scaling Companies and Fractional CMO Services.
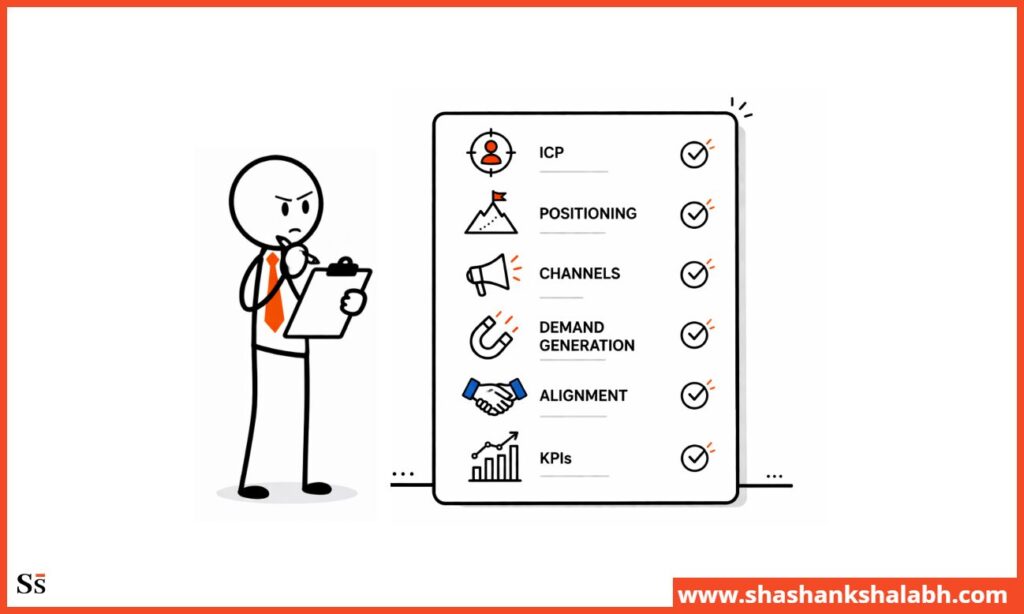
Checklist: B2B GTM Template
Use this to assess whether each component of the GTM system is in place:
ICP definition:
- Firmographic criteria documented from closed-won data
- Buyer roles and decision-making structure mapped
- Pain points and buying triggers identified
- Disqualification criteria defined
Positioning and messaging:
- Problem statement written from the buyer’s perspective
- Differentiation framework built against actual competitive alternatives
- Value proposition passes the “so what?” test
- Three to four messaging pillars defined and connected to buyer concerns
Channel prioritization:
- Channels evaluated against ICP reach, CAC efficiency, scalability, and time to pipeline
- Two primary channels selected for depth investment
- Budget allocation framework documented
Demand generation architecture:
- Funnel stage definitions agreed by marketing and sales
- Content strategy mapped to funnel stage and buyer question
- Campaign structure template in use for all active programs
- Handoff protocol documented and operational
Sales-marketing alignment:
- MQL and SQL definitions agreed in writing by both teams
- Handoff protocol with SLAs documented
- Weekly, monthly, and quarterly feedback loops established
- Marketing-sourced revenue tracked as a primary KPI
KPI framework:
- Pipeline, efficiency, conversion, and retention metrics all tracked
- CAC calculated correctly – including sales costs
- Reporting cadence established – weekly, monthly, quarterly, annual
- KPI dashboard reviewed jointly by marketing and sales monthly
Scoring:
- 0-5 items: GTM system needs significant work before scaling spend
- 6-10 items: Partial system. Identify the gaps and prioritize highest-impact fixes
- 11-15 items: Strong foundation. Optimize and scale
- 16-20 items: Mature GTM system. Focus on compounding improvements
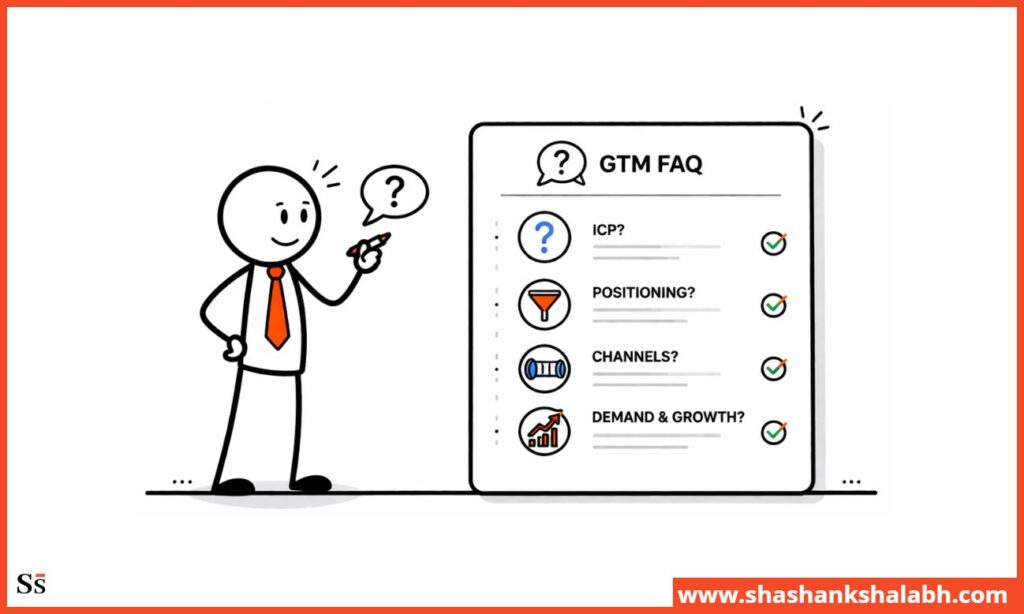
FAQ: B2B GTM Template
Let’s address all common questions related to go-to-market template for B2B businesses.
What is a B2B go-to-market strategy?
A B2B go-to-market strategy defines how a company brings its product or service to market, including who it targets, what it says, which channels it uses, and how it ties marketing activity to revenue.
It is broader than a marketing plan. A marketing plan focuses on tactics. A GTM strategy defines the system those tactics operate within, including ICP, positioning, channel strategy, demand generation architecture, sales alignment, and KPI governance.
Without all six working together, marketing produces activity without predictable revenue.
What should a GTM template include?
A complete B2B GTM template includes ICP definition. positioning and messaging framework, channel prioritization matrix, demand generation architecture, sales and marketing alignment protocol, and KPI framework
How do you build a go-to-market plan?
Build a GTM plan in sequence, not in parallel.
- Define ICP from closed won data
- Build positioning
- Choose the right channels
- Build demand generation around the ICP’s buying triggers
- Align Marketing & Sales
- Create the KPI framework
What are common GTM mistakes?
Some of the most common GTM mistakes are selecting channels before defining ICP and positioning, ICP that’s too broad, positioning that mirrors competitors, sales-marketing misalignment, and scaling before measuring.
How does GTM impact pipeline growth?
A well built GTM system drives 50-150% pipeline growth within 6-12 months of consistent execution.
The gains come from four areas.
- A tighter ICP improves MQL to SQL conversion.
- Stronger positioning shortens sales cycles and increases win rates.
- Channel optimization reduces CAC by 20 to 35 percent by shifting budget to the most efficient sources.
- Sales and marketing alignment removes wasted pipeline caused by inconsistent qualification.
Each improvement builds on the next. A better ICP strengthens positioning. Stronger positioning improves channel performance. Better channels lower CAC. Lower CAC allows more investment in what is already working.

Closing Thought: B2B GTM Template
Don’t think of a B2B GTM template as a document to fill in. It is a system to build, one component at a time, where each part depends on the one before it.
Businesses that grow pipeline consistently have a clear ICP, specific positioning, disciplined channel allocation, and strong sales and marketing alignment.
Build the system. Measure it correctly. Optimize before you scale.
Repeating that sequence consistently is what turns marketing from a cost center into a revenue engine.
Suggested Read:

Shashank brings over 22 years of global omnichannel marketing experience. As a 4x Chief Marketing Officer, he has helped several organizations (Startups and Fortune 500) drive sustainable revenue growth through strategic marketing.