
A revenue bottleneck is the one constraint in a company’s revenue system that slows growth more than anything else. Growing organizations face many revenue issues, but one barrier usually matters most.
Fixing the wrong problem produces marginal improvement. If you want disproportionate growth, find and fix the real bottleneck.
This revenue bottleneck framework shows how to identify and fix the primary blocker to increase revenue.
What this framework covers:
- Types of revenue bottlenecks
- How to identify which constraint is primary?
- Marketing vs Sales bottlenecks
- How companies fix each bottleneck type?
- How a fractional CMO helps address revenue bottlenecks?
What Is a Revenue Bottleneck?
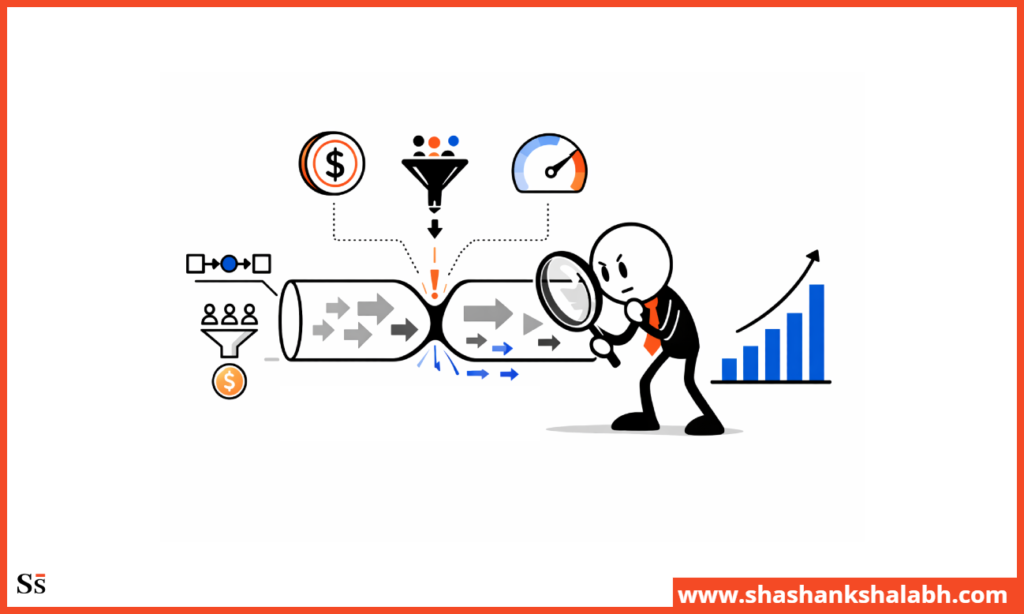
A revenue bottleneck is the single point in your revenue system (marketing, sales, and operations working together) that limits growth more than anything else.
The concept comes from Systems Thinking.
In any connected system, one constraint determines the output of the entire system. You will see little change if you try improving everything except the main constraint. When you identify and remove the true constraint, you create results far greater than the effort invested.
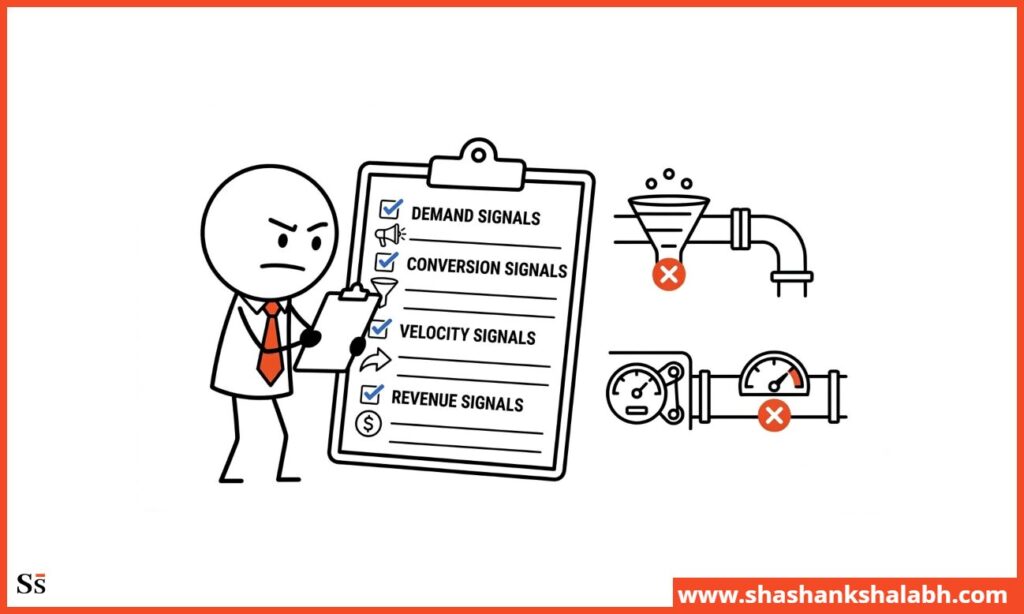
The growth barrier usually appears in three clear ways:
Pipeline Breakdown: Qualified opportunities are not entering the funnel at the rate the revenue target requires. This is a demand generation or positioning problem.
Conversion breakdown: Opportunities are entering the funnel but not progressing through it at the expected rate. This is due to issues in the sales process, messaging, or lead quality.
Velocity constraint: Opportunities are progressing but too slowly to support accurate forecasting or revenue target achievement. This suggests problems with deal structure, sales capacity, or qualification.
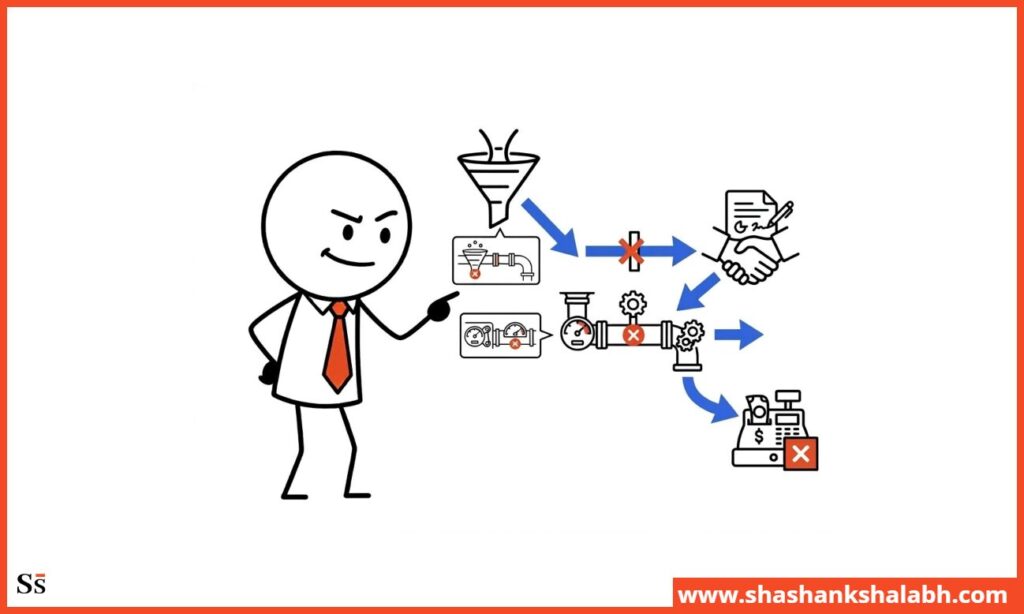
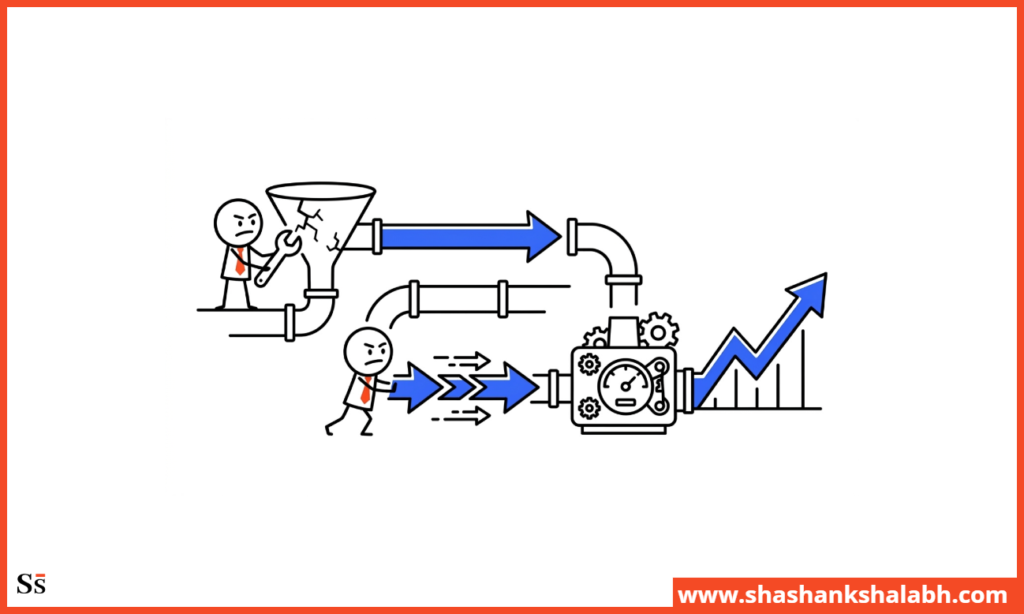
Most scaling companies experiencing revenue stagnation have multiple revenue problems. The real challenge (and the reason many turnaround efforts fail) is that teams fix visible symptoms instead of the primary constraint.
What I have observed is that a business with a positioning problem launches more campaigns. And if there is a conversion problem, they hire more salespeople. Likewise, they push more leads into the funnel when they see a velocity issue.
None of these actions remove the real issue.
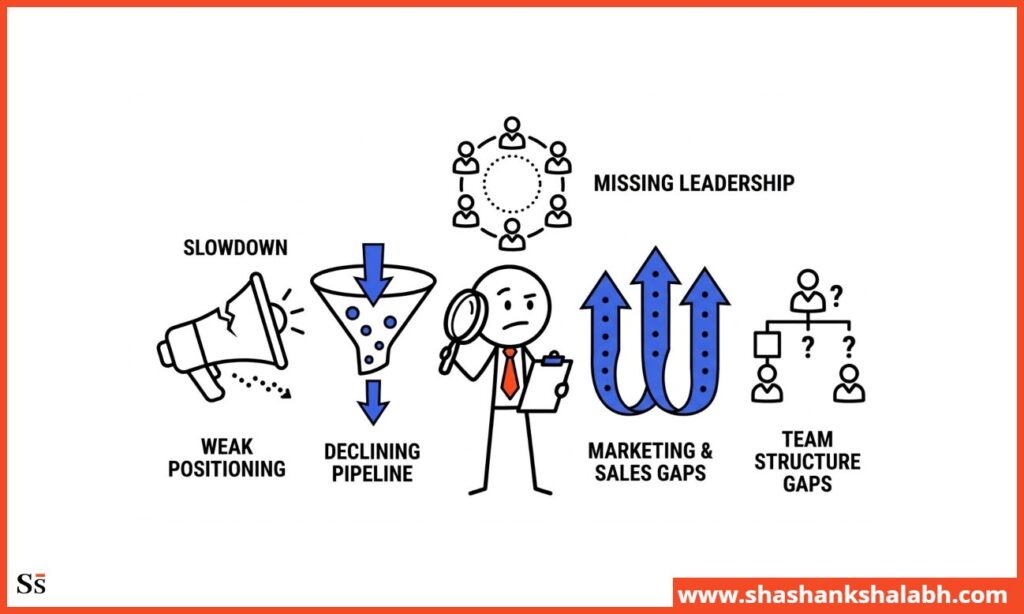
Why Revenue Growth Slows Down in Growth-Stage Companies?
As companies grow, revenue growth often slows for familiar reasons.
I’ve diagnosed the same patterns across companies at every stage from $5M to $50M revenue. Here’s what consistently produces the constraint:
Positioning Not Converting
Positioning built for an earlier market, an earlier ICP, or an earlier competitive landscape eventually stops working. The message resonated with early adopters (technical buyers, founder networks, and early communities) but loses impact as the company moves toward mainstream buyers who evaluate solutions differently.
Growth slows because the positioning no longer connects the product to the buyers the company now needs to reach.
Unscalable Pipeline Generation
Early revenue often comes from channels that don’t scale. These include founder relationships, warm introductions, a single content channel, or one partnership that worked.
These create an uneven pipeline because they depend on personal effort, not a repeatable demand engine. When these sources max out (and they always do), the pipeline shrinks unless a scalable system is put in place.
Since the demand system wasn’t designed to work without the founder or a single lead source, growth slows.
Misidentified Sales Issues
When the pipeline seems full but revenue isn’t growing, companies often try to fix it by generating more leads. They try running more campaigns, spending more, and boosting top-of-funnel activity.
But the real problem is usually conversion. Leads are entering the pipeline, but they aren’t turning into closed deals as expected. Misreading this is costly. Marketing spend goes up, but the conversion gap keeps growing.
The bottleneck isn’t demand. It’s what happens to demand after it enters the pipeline.
Marketing Team Structure Gaps
Revenue growth slows when the marketing team doesn’t have the right skills to execute the strategy. A team of generalists can’t handle the specialized work needed for demand generation, product marketing, and RevOps at a growth stage.
The problem comes from a mismatch between the team’s structure and the company’s growth needs. Adding more people without fixing the skill gap doesn’t improve results.
No Executive Marketing Accountability
When no executive is responsible for marketing results, the company focuses on activity instead of revenue. Pipeline drops, customer acquisition costs (CAC) go up, and conversion rates fall.
Each team tracks its own metrics, but no one looks at the big picture.
The real bottleneck is the absence of leadership that owns revenue outcomes and has the power to identify and fix the main constraint.
The Revenue Bottleneck Framework
I use a straightforward four-step process to identify the main issue slowing a company’s revenue.
Each step targets a specific type of bottleneck, with clear causes and solutions. You start with Step 1 and move forward until you find the constraint that has the biggest impact.
Stage 1: Demand Bottleneck
The company isn’t getting enough good leads to meet its revenue goals.
A demand bottleneck occurs when the problem is at the top of the funnel. There just aren’t enough qualified opportunities coming in, even if everything else in the revenue system works well.
Improving conversion rates, sales velocity, or deal structure won’t help if there isn’t enough qualified pipeline to work with.
Diagnostic signals:
- Pipeline coverage ratio below 2:1 against revenue targets
- Marketing-sourced opportunities declining quarter-over-quarter
- Sales team has capacity but not enough qualified opportunities to work
- CAC rising because volume is declining while cost is stable
Primary causes:
- Positioning isn’t resonating with the target ICP
- Channel strategy too narrow or too concentrated in saturating sources
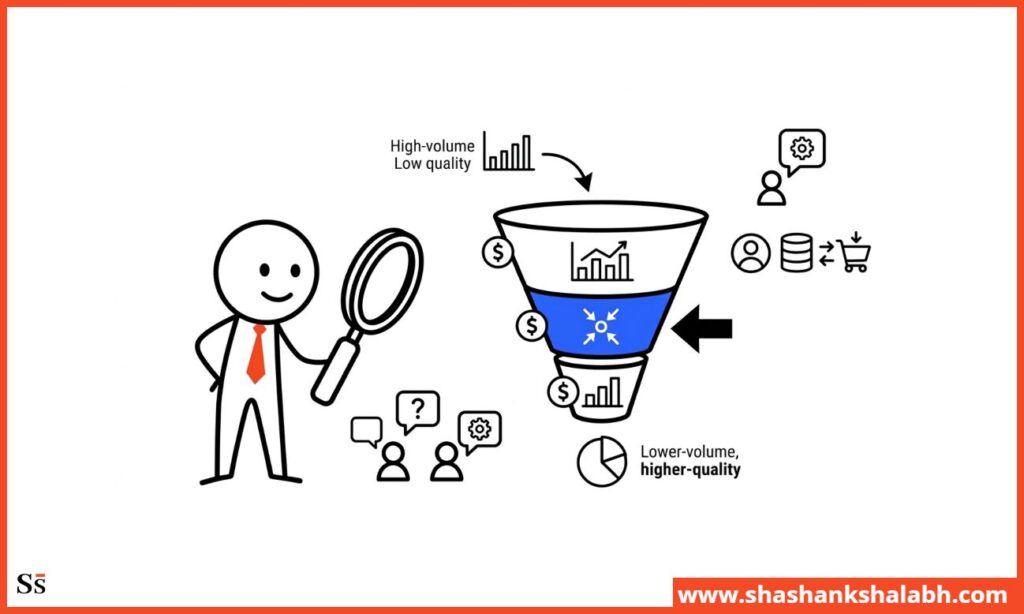
- ICP definition is too broad. High volume but poor quality
- Demand generation system dependent on founder involvement
Solution: Refine ICP, rebuild positioning, diversify channels, and build a systematic demand-generation infrastructure.
Stage 2: Conversion Bottleneck
Leads are coming in, but they’re not turning into revenue as expected.
A conversion bottleneck happens when the middle of the funnel is the problem. Marketing-qualified leads (MQLs) aren’t becoming sales-qualified leads (SQLs), SQLs aren’t becoming opportunities, or opportunities aren’t closing.
The top of the funnel is generating leads, but revenue is being lost in the middle.
Diagnostic signals:
- Enough leads, missing revenue
- Low MQL-to-SQL conversion
- Declining opportunity-to-close rate
- Longer sales cycles without bigger or more complex deals
Primary causes:
- Poor lead quality: marketing targets the wrong ICP
- Sales and marketing misaligned on qualification
- Messaging sparks interest but doesn’t drive decisions
- Gaps in sales process: discovery, objections, competitive positioning
- Missing enablement materials to help close deals
Solution: Tighten ICP, align MQL/SQL definitions, build sales enablement, audit the sales process, and refine positioning for economic buyers.
Stage 3: Pipeline Velocity Bottleneck
Deals are coming in and converting, but they’re moving too slowly through the pipeline to hit revenue goals.
A velocity bottleneck occurs when sales are closing, but at a slow pace. Even if the pipeline looks healthy in size and quality, long sales cycles cause cash flow issues, inaccurate forecasts, and missed revenue targets that seemed doable just a few months ago.
Diagnostic signals:
- Sales cycles getting longer each quarter
- Adequate pipeline, but revenue targets missed
- Forecast accuracy under 85%; expected deals slip
- High pipeline, but revenue recognition is delayed and unpredictable
Primary causes:
- ICP drift. Pipeline deals with longer, more complex buying processes
- Lacking access to decision-makers; relying on contacts without budget authority
- Losing to competitors late in the sales process
- Proposal and contract delays aren’t being tracked or managed
- Deal sizes are growing, but the sales process isn’t keeping up
Solution: Tighten ICP qualification, engage multiple stakeholders, strengthen competitive positioning, define sales stages, and improve forecasting discipline.
Stage 4: Revenue Execution Bottleneck
The revenue system is generating demand, converting pipeline, and closing deals. But it’s losing money because customers are leaving (churn), downgrading, or not buying more.
A revenue execution bottleneck happens when new sales are fine, but retention and growth aren’t. The company is replacing lost revenue just to stay in place, and customer lifetime value (LTV) is dropping.
Diagnostic signals:
- Annual retention below 70–80%
- Net revenue retention under 100%; losses exceed expansions
- LTV:CAC declining despite stable/improving CAC
- Healthy customer acquisition, but slow ARR growth
Primary causes:
- ICP mismatch. You are acquiring customers who aren’t the right fit for long-term retention
- Weak onboarding causes users to leave before seeing value
- No structured upsell/cross-sell strategy
- Pricing doesn’t scale with customer usage
- Customer success team is too small for the customer base
Solution: Refine ICP to boost retention, redesign onboarding, implement structured expansion revenue program, review and optimize pricing, and assess and scale customer success capacity.
How to Identify Your Primary Revenue Bottleneck?
The framework is only useful if the diagnostic is rigorous. Here’s the process I use to identify the primary bottleneck:
Start With the Funnel Data
Pull conversion rates at every stage of the funnel.
Look from MQLs to SQLs, SQL to opportunity, and opportunity to closed-won.
The stage where the conversion rate is lowest relative to benchmark is the starting point for the diagnostic. Don’t start with assumptions. Start with the data.
For B2B SaaS companies at growth stage, here are the commonly referenced conversion benchmarks:
- MQL to SQL: 20-30%
- SQL to opportunity: 40-60%
- Opportunity to closed-won: 20-30%
Note that these vary materially by ICP, deal size, and sales motion. Use them as directional reference points, not absolute standards.
A conversion rate materially below benchmark at any stage identifies the funnel location of the bottleneck. It doesn’t identify the cause. That requires the next step.
Separate Volume Problems From Quality Problems
A low MQL-to-SQL conversion rate could mean marketing is generating too few leads. This is a volume problem.
Or, marketing is generating leads that don’t meet qualification criteria, which is a quality issue. These have different causes and different fixes.
Volume problems point to demand generation. Quality problems call for looking into ICP definition and targeting.
The diagnostic question:
If sales had unlimited capacity to follow up on every MQL, would the conversion rate improve?
Track CAC by Stage and Channel
Rising CAC is a symptom, not the problem itself.
If CAC rises because lead volume is dropping, there is a demand bottleneck. However, when CAC rises because conversion rates are falling, it points to a conversion bottleneck. If CAC rises because sales cycles are getting longer, it shows a velocity issue.
Analyzing CAC by component shows which stage of the framework is the main constraint.
Interview the Revenue Team
Funnel data shows where the problem is. Revenue team interviews reveal why.
I conduct structured interviews with sales, marketing, and customer success leaders to understand where each sees the constraint. The strongest signal of the primary bottleneck comes when the data and these perceptions align.
When they conflict (which happens often), the data is usually the more reliable guide.
Validate With Customer Data
Win/loss analysis and customer interviews are some of the most underused tools in scaling companies.
Analyze, why do deals close. Or, why do they slow down? Why do customers churn?
The answers almost always reveal the primary revenue bottleneck, whether it’s positioning, qualification, velocity, or retention. I treat customer data as a required input for every revenue bottleneck diagnosis.
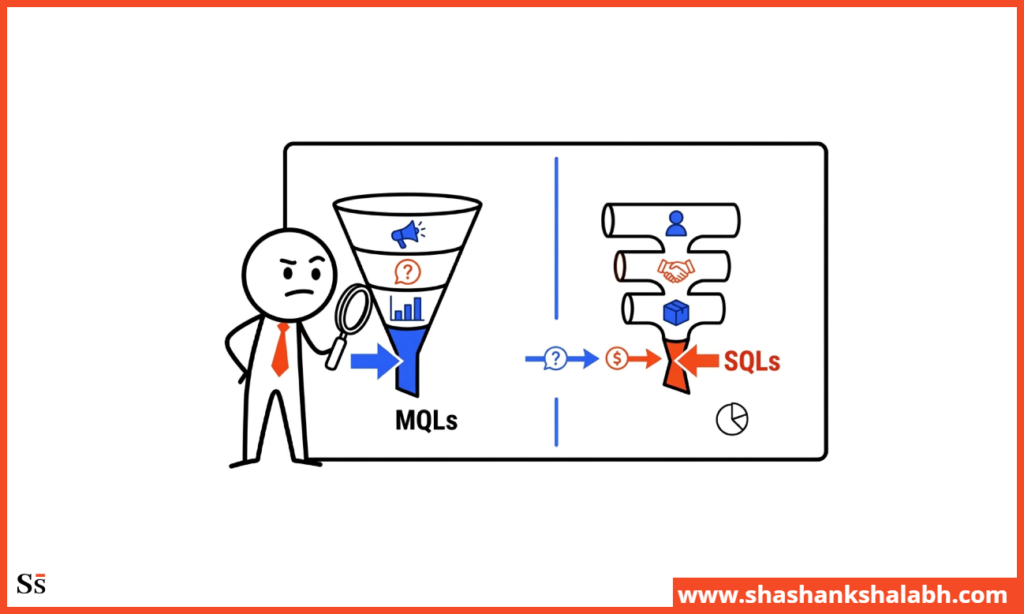
Marketing Bottlenecks vs. Sales Bottlenecks
A costly mistake in revenue growth is blaming marketing for a sales bottleneck, or blaming sales for a marketing bottleneck.
It wastes money, slows pipeline, and hides the real constraint.
Marketing Bottlenecks
Marketing bottlenecks occur in the demand generation and positioning layer of the revenue system.
They show up as too little pipeline, low-quality leads, declining channel results, or messaging that creates awareness but fails to generate qualified demand.
Marketing is the primary bottleneck when:
- Pipeline coverage under 2:1; marketing-sourced opportunities declining
- Rising CAC due to declining volume with steady spend
- Multiple channels underperforming—indicates positioning issues, not channel problems
- Sales team has capacity but lacks enough qualified opportunities
Marketing bottleneck fixes:
- Refine ICP using closed-won data
- Rebuild positioning for the current competitive context
- Reset channel strategy: exit underperforming channels and invest in high CAC-efficiency sources
- Rebuild demand generation: shift from ad hoc campaigns to systematic pipeline programs
Sales Bottlenecks
Sales bottlenecks occur in the conversion and velocity layer of the revenue system.
They show up when pipeline volume is healthy but conversion rates are low, sales cycles grow longer, or many opportunities produce few closed deals.
Sales is the primary bottleneck when:
- Adequate pipeline, but revenue targets consistently missed
- Declining opportunity-to-close rate with unchanged ICP or deal size
- Increasing sales cycle length without more complex deals
- Win/loss analysis shows late-stage losses to competitors
Sales bottleneck fixes:
- Audit sales process: stage definitions, exit criteria, activity requirements
- Strengthen competitive positioning and objection handling
- Develop multi-stakeholder engagement strategy for complex deals
- Align sales enablement materials to the buying process
- Improve forecast discipline: stage-based probabilities, commit vs. best-case categorization
When Both Are Present Simultaneously
Marketing and sales bottlenecks often exist at the same time. A weak market position attracts poor-fit leads that sales cannot convert.
Marketing generates volume, sales struggles to close deals, and each team blames the other.
The real challenge is identifying which bottleneck comes first.
In my experience, positioning is the most common root cause when both teams underperform at the same time. Fix the positioning, and lead quality improves, conversion rates rise, and revenue follows.
How Companies Fix Revenue Bottlenecks?
The solution depends on the type of bottleneck. Here is the intervention framework for each stage:
Fixing a Demand Bottleneck
The demand generation bottleneck fix follows a clear sequence: refine the ICP, rebuild positioning, reset channel strategy, then build a repeatable demand engine.
The order matters. Investing in channels before fixing positioning creates a high-volume, low-quality pipeline. Likewise, fixing positioning before refining the ICP produces strong messaging aimed at the wrong buyer.
ICP refinement must come first.
Timeline: 30-60 days for ICP and positioning work. 60-90 days for resetting channels and rebuilding demand generation. A 10-25% pipeline increase is a realistic 90-day outcome. A fully performing demand system usually takes around 6-9 months.
Fixing a Conversion Bottleneck
This stage requires the following steps (in order):
- Define shared MQL and SQL criteria
- Audit the sales process by stage
- Identify the exact point where deals stall
- Build enablement and positioning that address that break point
Conversion fixes often deliver faster revenue impact than demand fixes. The pipeline already exists, so better conversion turns current opportunities into revenue more quickly.
Timeline: 30-60 days for shared definitions and a full process audit. 60-90 days for building sales enablement and refining positioning.
Conversion gains usually become measurable within 60-90 days. With consistent execution, expect a 20-40% improvement in conversion rate within 6–12 months.
Fixing a Velocity Bottleneck
The velocity bottleneck can be fixed using this sequence:
- Define stage exit criteria precisely
- Implement multi-stakeholder engagement protocols
- Strengthen competitive positioning for late-stage objections
- Establish deal review cadence with clear escalation criteria
Velocity fixes are the most process-intensive. They require sales leadership commitment and consistent execution discipline.
Timeline: 30-60 days for process changes. You should be able to measure sales cycle improvement within one full sales cycle after implementation.
Shortening the average sales cycle can boost revenue from the existing pipeline, often matching the impact of an equivalent increase in the close rate.
Fixing a Revenue Execution Bottleneck
The revenue execution issue requires the following steps (in order):
- Tighten ICP to improve retention profile
- Redesign onboarding to accelerate time-to-value
- Implement systematic expansion revenue programs
- Review pricing structure against value delivery
Revenue execution fixes have the highest LTV impact. Note that improving retention from 70% to 85% annual retention produces a 50%+ improvement in LTV without acquiring a single additional customer.
Timeline: Onboarding redesign takes 60-90 days. The expansion revenue program takes 90-120 days to produce measurable results. Retention improvement becomes visible over 6-12 months. Expect 30-50% growth in LTV:CAC within 12 months of systematic execution.
Where Fractional CMOs Fit Into Revenue Bottleneck Diagnosis?
The Revenue Bottleneck Framework requires executive-level diagnosis. Someone must assess the entire revenue system, identify the main constraint, and prescribe a fix that addresses the root cause, not just the symptoms.
And that is where a fractional CMO shines.
Identifying Growth Constraints Across the Full Revenue System
Most marketing leaders look at problems from their own area. They can clearly see marketing issues, but only partly understand sales problems.
A fractional CMO with experience across both teams looks at the whole system… How leads are generated, how they convert, how fast deals move, and how revenue is closed. This broader view makes it easier to find the real problem without bias.
I have seen companies spend heavily on demand generation to fix what was actually a conversion problem. I have also seen teams build complex retention programs when the real issue was an ICP mismatch that brought in the wrong customers.
Working with many companies at similar growth stages helps spot these patterns faster and leads to quicker, more accurate diagnosis.
Restructuring Marketing Systems Around the Primary Constraint
Once the main problem is clear, the part-time CMO creates a focused plan to fix that specific issue. I have already covered the steps to address demand and conversion bottlenecks earlier in this post.
Note that this is a targeted approach. This is not a generic marketing improvement program.
Aligning Marketing and Sales Around Shared Revenue Accountability
When problems happen at the marketing-sales handoff (the conversion stage), you need someone who understands both sides.
A part-time CMO can align the teams by setting clear rules for what counts as a good lead, how deals are tracked, and how forecasts are made. This helps remove confusion and disconnects.
Companies where sales and marketing work well together grow 50-80% faster. Most issues at this stage come down to those teams not being aligned.
Read: Fractional CMO Services and Go-To-Market Strategy for Scaling Companies to understand this better.
Checklist: Is Your Company Experiencing a Revenue Bottleneck?
Use this diagnostic to assess which bottleneck type is most likely affecting your revenue system:
Demand bottleneck signals:
- Pipeline coverage is below 2:1 against revenue targets
- Marketing-sourced opportunities are declining quarter-over-quarter
- Sales team has capacity but insufficient qualified opportunities
- CAC is rising while marketing spend is stable or increasing
Conversion bottleneck signals:
- Enough leads, missing revenue
- Low MQL-to-SQL conversion
- Declining opportunity-to-close rate
- Longer sales cycles without bigger or more complex deals
Velocity bottleneck signals:
- Sales cycles getting longer each quarter
- Adequate pipeline, but revenue targets missed
- Forecast accuracy under 85%; expected deals slip
- High pipeline, but revenue recognition is delayed and unpredictable
Revenue execution bottleneck signals:
- Annual retention below 70–80%
- Net revenue retention under 100%; losses exceed expansions
- LTV:CAC declining despite stable/improving CAC
- Healthy customer acquisition, but slow ARR growth
Using this checklist:
The category with the most checks usually points to the main problem.
If the checks are spread out, start with demand. That’s the most common issue for growing companies. Fixing demand often helps improve conversion and how fast deals move.
If any category has three or more checks, it means there’s a real problem there, and you may need a part-time CMO to fix it.
Read: Fractional CMO for Growth-Stage Companies
FAQ: The Revenue Bottlenecks
What is a revenue bottleneck?
A revenue bottleneck is the one main issue that slows growth more than anything else. There may be many problems, but one matters most. If you fix other things instead, you’ll only see marginal improvement.
The Revenue Bottleneck Framework identifies which of four constraint types (demand, conversion, velocity, or revenue execution) is primary and what it takes to remove it.
How do you identify revenue bottlenecks?
You need to look at funnel conversion data by stage, CAC by channel and period, and qualitative interviews with the revenue team and customers to find revenue bottlenecks.
The funnel data shows where conversion is breaking down. CAC decomposition shows which component of acquisition cost is driving the increase. Revenue team and customer interviews explain why the breakdown is occurring.
Using both data (numbers) and real feedback helps find the main problem more reliably. It’s usually hard to figure this out by looking only at funnel data or only by talking to the team.
Why does revenue growth slow down?
Revenue growth slows down when a high-growth company hits the ceiling of its current revenue system without building the next version.
In most cases, the cause is outdated positioning, unscalable demand generation system, misattributed sales issues, misaligned marketing structure, or absence of marketing accountability
What causes pipeline bottlenecks?
Pipeline bottlenecks (aka demand bottlenecks) happen due to misaligned positioning, ineffective channel strategy, a broad ICP definition, or founder-dependent demand generation. The key question is whether the problem is a lack of enough leads, or that the leads coming in aren’t good enough.
Who should diagnose revenue bottlenecks in a company?
This requires visibility across the entire revenue system, covering marketing, sales, and the handoff between them. And the experience to separate primary constraints from secondary symptoms. A CMO or CRO can address this well.
Internal marketing leaders often misdiagnose bottlenecks because they see marketing problems clearly but sales problems only partially.
A part-time CMO who has worked across different teams and helped several companies grow at similar stages can step back, see the bigger picture, and spot what’s slowing things down.

Closing Thought: Revenue Bottleneck
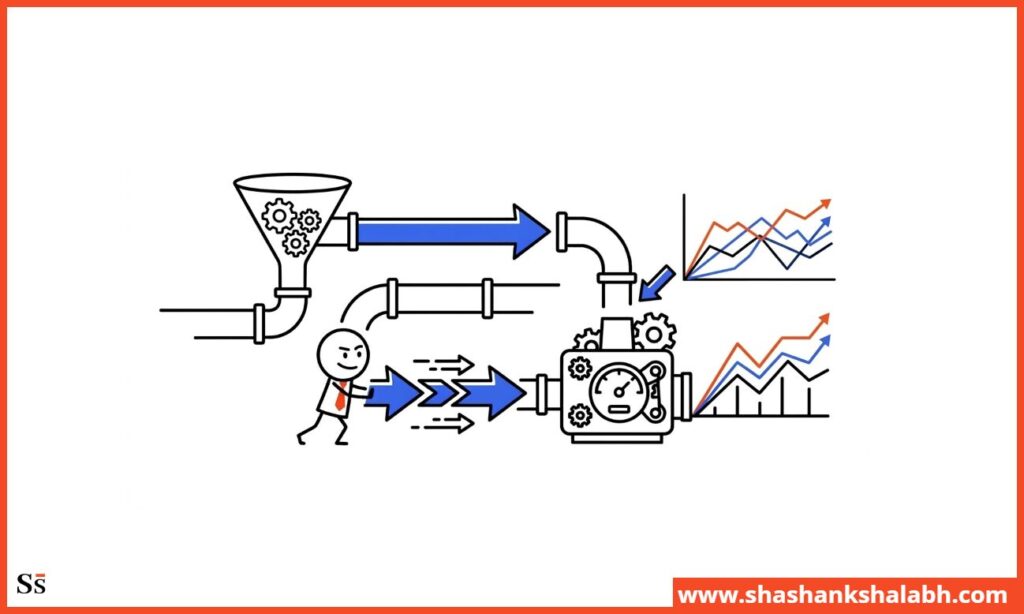
What I have observed is that most businesses in the growth phase try to solve surface issues while the core issues keep growing underneath.
Please note that the Revenue Bottleneck Framework doesn’t prescribe a universal solution. Instead, it identifies the specific constraint. And once you remove this, the result is disproportionate revenue improvement.
Efficiency and growth do not come from spending the most on marketing. Successful businesses know exactly where their revenue system is breaking down and invest precisely in removing that constraint.
Related Posts: