
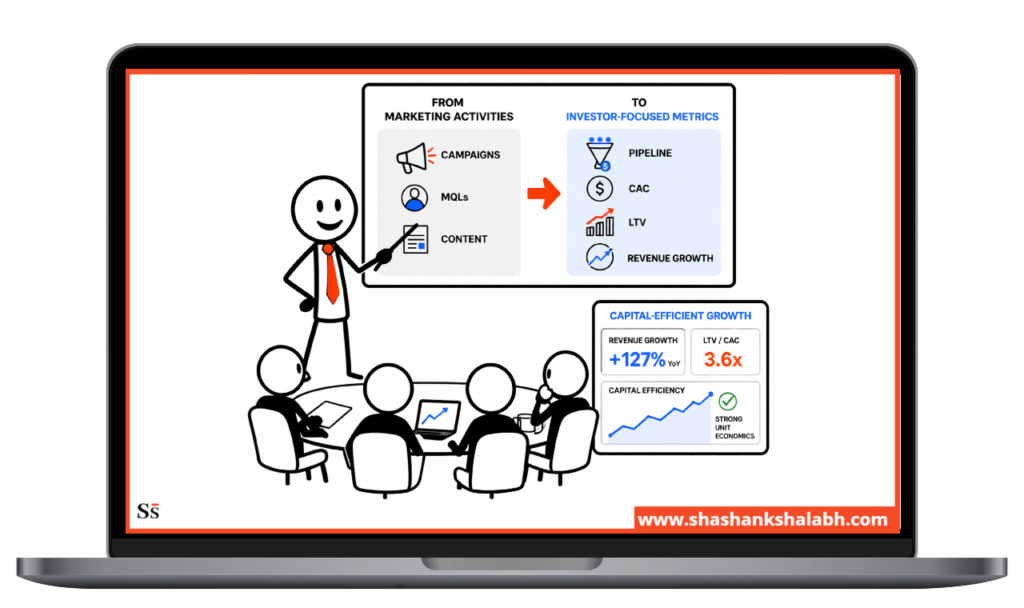
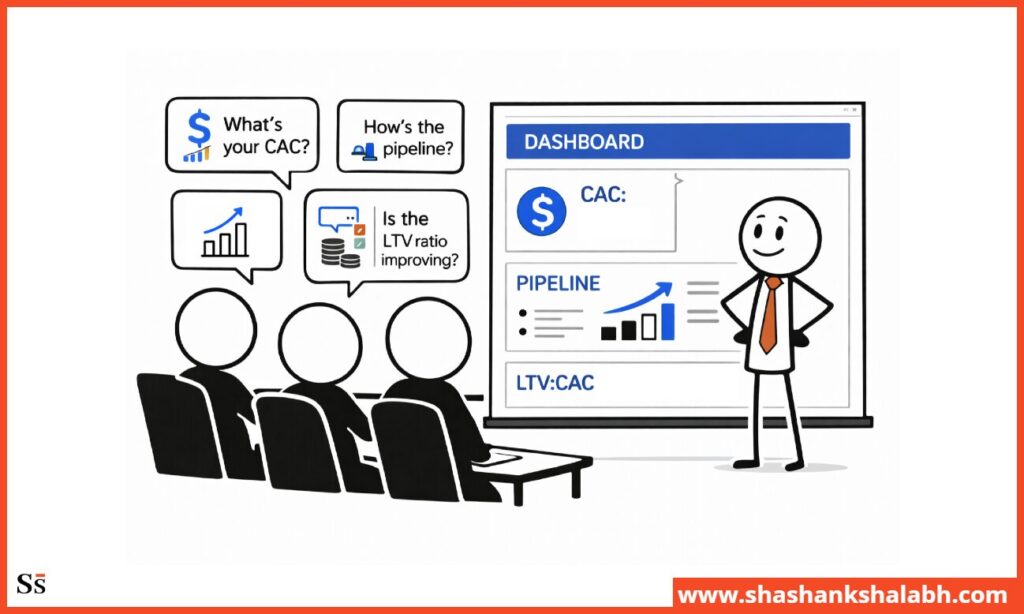
Most SaaS founders walk into board meetings with marketing activity reports and walk out having lost investor confidence.
Boards don’t want to see campaigns, content volume, or MQL counts.
They want to know whether marketing is building a capital-efficient growth engine.
This guide covers what Series A and B investors actually scrutinize, how to frame the numbers, and how to handle the questions that make most founders sweat.
Here’s what you will learn in this guide:
- The 6 metrics SaaS boards actually scrutinize, and what they’re really asking
- What Series A boards focus on versus Series B boards
- How to structure the marketing slide in your board deck
- How to handle the hard questions without losing confidence
- How to present declining metrics without losing the room
This guide draws on fractional CMO Shashank Shalabh’s 22 years of marketing experience, preparing board reporting for venture-backed SaaS companies across Series A and Series B.
Why Most Founders Present Marketing Wrong to Boards
Most marketing presentations to boards fail before the first question. The problem is what numbers they show and how they frame them.
Activity Reports vs Business Outcome Reports
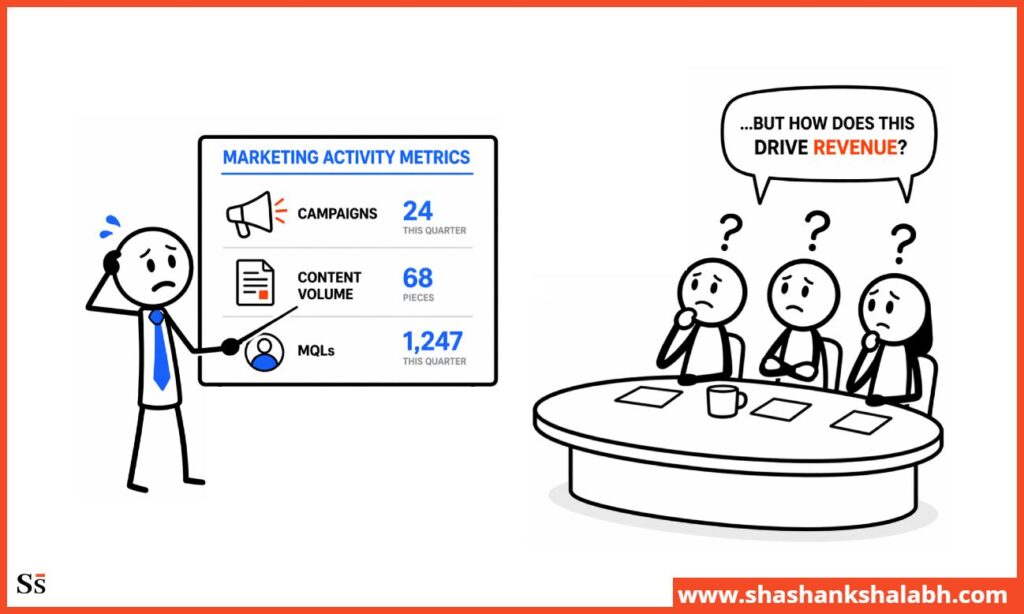
Marketing teams default to activity reports because activity is easy to measure.
For example, impressions, MQLs, content output, and open rates are real and trackable, and they make teams look busy.
Boards don’t evaluate these numbers. They are judging whether marketing is building a growth engine that adds up. And that is why they want to see revenue metrics.
The Language Gap: Marketing Speak vs Investor Speak
Marketing leaders talk about campaigns, channels, and qualified leads. Investors talk about capital efficiency, payback periods, and operating leverage.
When founders present in marketing language, the board has to translate to make sense of it. That translation creates friction, and friction creates questions.
Present in investor language, and the board spends less time decoding the numbers and more time focusing on what to do next.
Why Boards Ask Hard Questions
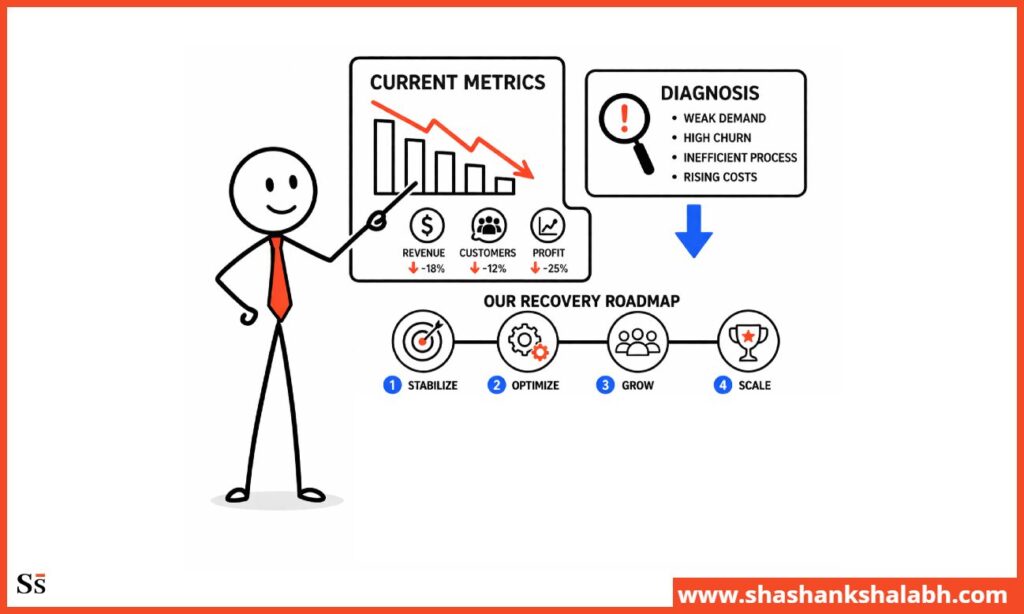
Hard board questions aren’t attacks. They’re tests of whether the founder understands their own business.
When a board member asks “why is CAC going up?”, they’re not looking for an apology. They’re checking whether the founder has a diagnosis, a plan, and a timeline.
Founders who answer with a specific root cause and a credible recovery plan build confidence. And those who answer with “it’s the market” lose it.
Series A vs Series B Board Expectations
Series A boards are evaluating repeatability.
Can the company acquire customers without the founder doing every deal?
Is CAC stable as the company scales? Is there evidence of a channel that works beyond one or two early wins?
Series B boards are checking efficiency.
- Capital: Is the company deploying capital intelligently?
- Is LTV:CAC improving as spend increases?
- Leverage: Is marketing creating operating leverage, or just buying revenue at a constant cost?
While the SaaS board metrics are similar, the questions underneath them are different.
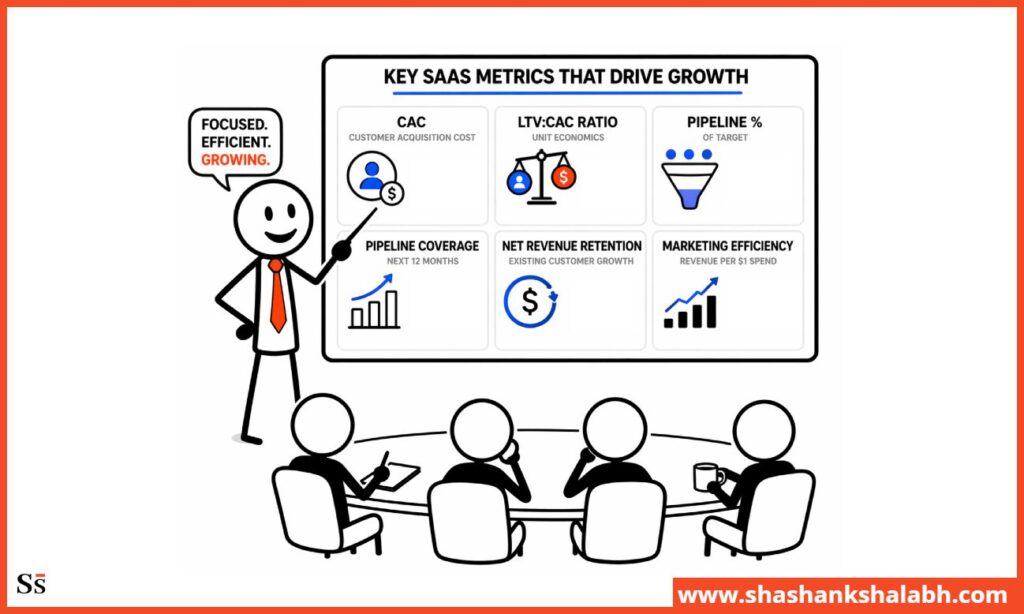
The 6 Metrics SaaS Boards Actually Scrutinize
These aren’t generic marketing KPIs. Each metric has a question underneath it that the board is really asking. Understanding that question changes how you present the number.
CAC and CAC Payback Period
What boards are really asking: “Can this company grow without burning through all our capital?”
CAC (customer acquisition cost) is the total cost of marketing and sales divided by new customers acquired in the period.
And CAC payback period is how many months it takes to recover that cost from the customer’s revenue contribution.
Benchmarks:
- Series A: CAC payback under 18 months is the minimum viable threshold
- Series B: CAC payback under 12 months is expected. Under 6 months is excellent
How to present it:
Don’t show a single point-in-time CAC number. Show the 12-month trend.
A CAC that’s $12,000 and declining is a better story than a CAC that’s $8,000 and rising. The trend tells the board whether the acquisition engine is getting more or less efficient as the company scales.
What kills credibility:
Presenting CAC without including sales costs. Boards know this is a common omission. If your methodology excludes sales salaries, someone will ask. Include them before they do.
LTV:CAC Ratio
What boards are really asking: “Is the business model sustainable at scale?”
LTV:CAC ratio measures whether the company is building profitable customer relationships or subsidizing growth with capital. A ratio of 3:1 means every dollar spent acquiring a customer returns three dollars in lifetime value.
Benchmarks:
- Minimum viable: 3:1
- Healthy: 4:1-5:1
- Excellent: 5:1+
How to present it:
Show the improvement trajectory, and not just the current ratio.
A company moving from 2.5:1 to 3.2:1 over 12 months tells a more credible story than a static 4:1 with no trend data. Boards want to see the direction, not just the destination.
How to handle a ratio below 3:1
Don’t hide it and don’t apologize for it.
Lead with the diagnosis. Is the problem CAC, is it retention, is it pricing?
Then show the specific lever you’re pulling and the timeline for improvement. A below-benchmark number with a credible recovery plan is better than a number you can’t explain.
Marketing-Sourced Pipeline Percentage
What boards are really asking: “Can this company grow without the founder selling everything?”
Marketing-sourced pipeline is the percentage of qualified opportunities that originated from marketing – not from founder relationships, existing customer networks, or inbound sales outreach.
Series A boards typically expect marketing to source 25-40% of qualified pipeline, though this varies by GTM motion. Series B expectation is 40-60%. Product-led growth companies will differ from these benchmarks.
How to present it:
Attribution methodology matters here.
Boards increasingly scrutinize how the marketing-sourced number is calculated. Is it first-touch, last-touch, or multi-touch?
Before presenting the number, explain the methodology in one sentence.
What kills credibility: Claiming a high marketing-sourced percentage without being able to explain the attribution model. If you can’t describe how you calculated it, the number is worthless to the board.
Pipeline Coverage Ratio
What boards are really asking: “Will you hit your number next quarter?”
Pipeline coverage ratio shows how much real revenue opportunity you have against your goal. It is the total qualified pipeline divided by the revenue target for the period. A 3:1 coverage ratio means you have three dollars of qualified pipeline for every dollar of your target revenue.
The standard: 3:1 is the benchmark most Series A and B boards expect. Below 2:1 points to a pipeline gap that will likely hurt the quarter.
Above 4:1 can indicate a conversion problem. Either deals are entering the pipeline but stalling before close, or there is a sales capacity issue where the team can’t work all available opportunities.
How to present it with credibility
Don’t just show the ratio. Show pipeline by stage. A 3:1 ratio where 80% of pipeline is in early discovery stages is a different story than a 3:1 ratio where 60% is in late-stage evaluation. Stage mix shows how much pipeline is likely to convert.
Net Revenue Retention
What boards are really asking: “Are you acquiring the right customers?”
Net Revenue Retention (NRR) shows whether your existing customers are growing or shrinking revenue over time, including expansion, contraction, and churn. An NRR above 100% means your current customers generate more revenue each month without adding new ones.
The threshold: NRR above 100% is the benchmark for a healthy SaaS business. Annual retention of 70-80%+ is the minimum needed to support strong lifetime value.
How marketing influences NRR
When you attract the right customers, they stay and spend more. When you attract the wrong customers through broad targeting or unclear messaging, they churn. If NRR is below 100%, start with your ICP definition and positioning.
What to say if you’re below 100%
Acknowledge it, attribute it specifically (wrong ICP, weak onboarding, pricing mismatch), and show the specific change you’ve made to the acquisition strategy. Boards expect NRR challenges at Series A.
They want to see you understand why and what you’re doing about it.
Marketing Efficiency Ratio
What boards are really asking: “Is marketing spend creating operating leverage, or just buying revenue?”
Marketing Efficiency Ratio (MER) shows how much revenue you generate for every dollar spent on marketing.
Boards use it alongside CAC and LTV:CAC to judge capital efficiency, especially at Series B when leverage becomes a priority.
A company generating $4 of revenue for every $1 of marketing spend has a 4:1 MER. As the company scales, the board wants to see MER improving; meaning each dollar of spend produces more revenue over time.
Why it matters more at Series B
Series A boards focus on whether marketing can drive revenue at all. Series B boards focus on whether it does so more efficiently over time. A flat MER at Series B (the same return at $30M as at $15M) shows marketing is scaling linearly, not improving returns. Boards expect the ratio to rise as spend grows.
How to frame MER alongside growth rate
Present MER and revenue growth rate together. A company growing 60% year-over-year with improving MER is a different business than one growing 60% with flat or declining MER.
The first is building a scalable growth engine. The second is buying growth at a constant cost.
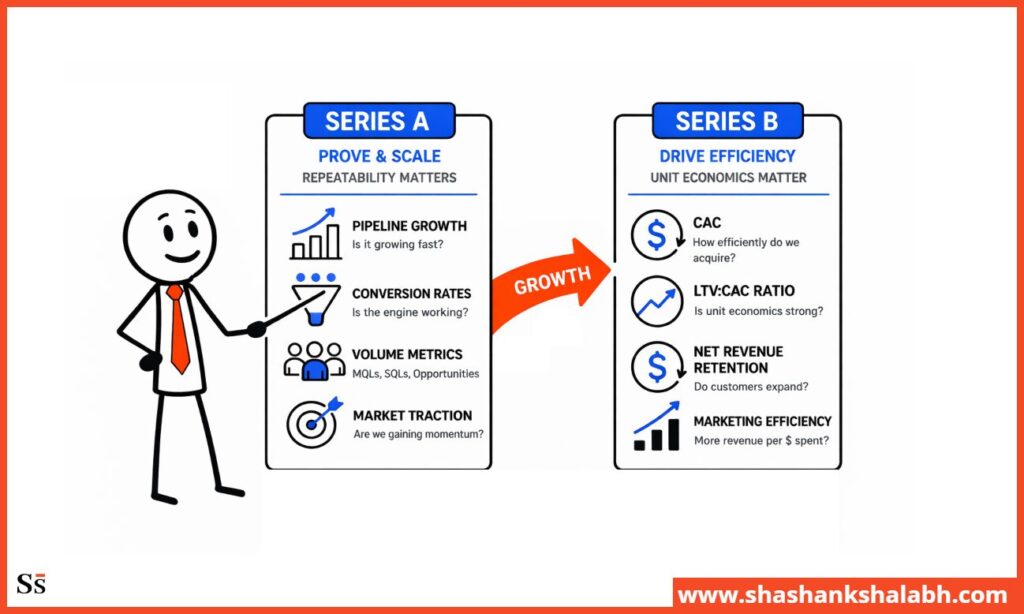
What Series A Boards Focus On vs Series B Boards
The metrics are largely the same at Series A and Series B. The questions behind them are different.
Series A: Proving Repeatability
Series A boards want proof that the company can acquire customers without the founder in every deal.
Is the CAC stable or improving as the company scales beyond founder-led sales?
What to show at Series A:
Early cohort data: are your first non-founder customers retaining at the same rate as founder-sourced customers?
Channel validation: do you have at least one channel producing a consistent, trackable pipeline beyond founder relationships?
Pipeline trend: is marketing-sourced pipeline growing as a share of total pipeline?
The Series A story: “We’ve shown we can acquire customers. Here’s proof we can do it in a repeatable way, not just through the founder’s network.”
Series B: Proving Efficiency
Series B boards want proof you can invest capital and turn it into efficient growth, not waste it.
Is the LTV:CAC improving as marketing spend increases?
What to show at Series B:
12-month CAC trend: is CAC declining or at least holding steady as spend scales?
NRR trajectory: is your existing customer base expanding, shrinking, or churning?
Channel ROI by source: which channels drive the highest return, and are you allocating budget accordingly?
The Series B story: “We’ve proven we can acquire customers efficiently. Here’s the evidence that the engine becomes more efficient as we invest more capital.”
What Both Stages Have in Common
Three things matter at both Series A and Series B, no matter how the rest of the numbers look.
Forecast accuracy
Boards at both stages need to trust the revenue forecast.
If you’ve missed pipeline or revenue targets in recent quarters, current numbers get more scrutiny. The target is 85% or higher accuracy. If you’re below that, explain why and what you’ve changed.
Attribution credibility
If you can’t clearly explain how the marketing-sourced pipeline is calculated, the number has no value.
The method matters more than perfection. A simple model that’s used consistently and easy to explain is more credible than a complex one no one understands.
Trend direction
A weak number that’s improving beats a strong number that’s declining. Every time.
Boards invest in where the business is going, not where it is. A CAC of $15,000 that’s dropping tells a better story than $10,000 that’s rising.

How to Structure the Marketing Slide in Your Board Deck
Most marketing board slides fail because they try to show everything. One slide, three headline numbers, twelve months of trend data. That’s it.
The One-Page Format Boards Prefer
Top section: three headline numbers
- CAC payback period (current month versus 12 months ago)
- LTV:CAC ratio (current versus prior quarter)
- Marketing-sourced pipeline percentage (current quarter versus prior quarter)
These three numbers answer the board’s primary question: is marketing building a capital-efficient growth engine?
Middle section: trend chart
- A 12-month trajectory for each of the three headline numbers
- One line per metric, labeled clearly
- Annotated variance periods showing when the line changed significantly
Bottom section: key initiatives and early results
- Two or three current initiatives with early performance data
- Strategic initiatives with measurable early signals
- Example: “Repositioned ICP to mid-market B2B. MQL quality score up 30%, CAC payback improving”
What to Put In vs What to Leave Out
In the board slide:
- Anything tied to revenue, pipeline, or capital efficiency
- Trend data showing direction of travel
- Attribution methodology
Out of the board slide:
- Impressions, social engagement, email open rates
- MQL volume without conversion rate context
- Content metrics
- Campaign names and creative descriptions
The one-slide rule:
If a board member would ask “so what?” cut it. Every metric should clearly answer that question.
CAC payback under 12 months means the growth engine is capital efficient.
Marketing-sourced pipeline at 45% means the company isn’t dependent on the founder to close deals.
If the “so what?” isn’t clear, the metric doesn’t belong on the slide.
How to Annotate the Slide So Questions Don’t Derail the Meeting
Boards ask questions when they don’t understand something or when they see something that concerns them. With good annotation, you can avoid both situations.
Explain methodology once
“CAC includes all marketing and sales costs divided by new customers in the period; fully loaded.” One sentence. Done.
Flag variances before the board sees them
If CAC spiked in one month, note it on the chart with a brief label, example, “sales team expansion month.”
Don’t let the board discover the spike and ask about it. Flag it first and the question becomes a confirmation rather than a concern.
Lead with the narrative, not the numbers
Lead with the narrative, not the numbers. Start the marketing section with the story- “Marketing is tracking ahead of plan on efficiency; here’s why and what we’re watching.”
Then show the numbers to support the story.
How to Handle the Questions That Make Founders Sweat
These are the questions most founders dread. Here’s how to handle each one.
Why Is CAC Going Up?
Don’t say, “It’s the market” or “iOS changes affected our paid acquisition.”
These answers tell the board the founder doesn’t control their own CAC, and can’t fix it. Both are confidence killers.
Do say: A specific diagnosis, a specific fix, and a timeline for improvement.
Here is the template structure:
Root cause: “CAC increased because we expanded into a new ICP segment that has a longer evaluation cycle”
What we did: “We’ve tightened ICP criteria to prioritize segments with sub-12-month payback”
Leading indicator: “MQL quality score is already improving. CAC should stabilize within 60 days”
The board doesn’t need the problem to be solved. They need to see that the founder understands why it happened and has a credible plan to address it.
Why Is Pipeline Down This Quarter?
Don’t say: “We had some team changes” or “Seasonality affected inbound.”
Do say: Root cause, what changed, and the leading indicators that recovery is underway.
Here is the template structure:
Root cause: “Pipeline declined because we paused paid acquisition during a channel audit”
What changed: “Audit is complete – we identified two underperforming channels and reallocated budget to the top two performers”
Leading indicator: “Organic pipeline is up 20% month-over-month. The total pipeline should recover within 45 days”
Boards accept pipeline problems. They don’t accept pipeline problems without explanations.
What’s Driving Your LTV:CAC Improvement?
This is a positive question and it trips founders up more often than negative questions do.
Boards ask this to check whether the founder understands their own business.
The wrong answer is “our marketing is working better.” The right answer attributes the improvement specifically.
Here is a strong answer (for example):
“Two things drove the improvement. We tightened ICP definition to exclude SMB customers who were churning at 40% annually, that improved LTV by reducing churn. We also shifted budget from paid social to organic content, which reduced CAC by 18% while maintaining pipeline volume.”
If you can’t attribute the improvement specifically, the board will wonder whether it was intentional, or whether you got lucky.
Is Your Marketing-Sourced Number Accurate?
Boards increasingly question attribution methodology.
Here is the right answer structure:
State the model: “We use first-touch attribution – the channel that first brought the prospect into our system gets credit”
Acknowledge the limitation: “First-touch understates the contribution of mid-funnel nurture content”
State the plan: “We’re building multi-touch attribution into our CRM over the next quarter”
What to say if your attribution isn’t perfect yet:
“Our attribution model is first-touch and it’s imperfect; we’re building toward multi-touch. The number is directionally accurate; we’re confident it’s between 35% and 45%, not between 20% and 60%.”
Directional credibility is better than false precision.
What Happens If We Cut the Marketing Budget 20%?
This question tests whether you understand which spend is working and which isn’t.
The wrong answer: “It would hurt growth significantly.”
This tells the board you don’t have channel-level data.
Here is the right answer structure:
Show channel-level spend and pipeline contribution: “Our budget breaks down as follows. Paid acquisition at 40%, content at 25%, events at 20%, outbound at 15%”
Identify where cuts would hurt: “A 20% cut to paid acquisition would reduce pipeline by approximately 15%; that channel is producing our best CAC payback”
Identify where cuts wouldn’t: “A 20% cut to events would reduce pipeline by less than 5%. That channel has our highest CAC and longest payback period”
The board is looking for channel-level clarity.
Founders who have it build confidence. And those who don’t reveal a data gap the board will remember.
How to Present Declining Metrics Without Losing Confidence
Declining metrics test leadership, not just marketing. How you present them matters as much as what the numbers show.
Lead With the Diagnosis, Not the Apology
“CAC increased 22% this quarter. Here’s why.”
That’s the right way to open.
Don’t start with “unfortunately, our CAC increased.”. This frames the number as a failure before the board has context.
Lead with the fact, then follow immediately with the diagnosis. The diagnosis shows the board you understand the business.
Anticipate and Flag Issues If You Noticed Them
Proactive flagging builds more trust than any positive metric.
If CAC has been rising for two months and the founder flags it in the pre-read with a note on what they saw and what they did, they look in control.
If the board discovers the trend during the meeting and it wasn’t flagged, the founder looks like they weren’t paying attention.
Show the Recovery Plan With Specific Milestones
A declining metric without a plan is a crisis.
With a credible recovery plan, it’s a managed situation.
Show the specific actions taken, the leading indicators you’re tracking, and the timeline for recovery.
For example: “We expect CAC to return to $8,000 by the end of Q3 as the channel reallocation takes effect” is credible.
“We expect things to improve” is not.
The One Thing Boards Respect More Than Good Metrics
Knowing why matters.
A board member who hears a founder explain why CAC increased, and what actions were taken, will trust that founder with more capital.
On the flip side, if they see a founder surprised by their own metrics, or unable to explain what drove them, they will start asking tougher questions about who is actually running marketing.
Building a Pre-Board Marketing Packet
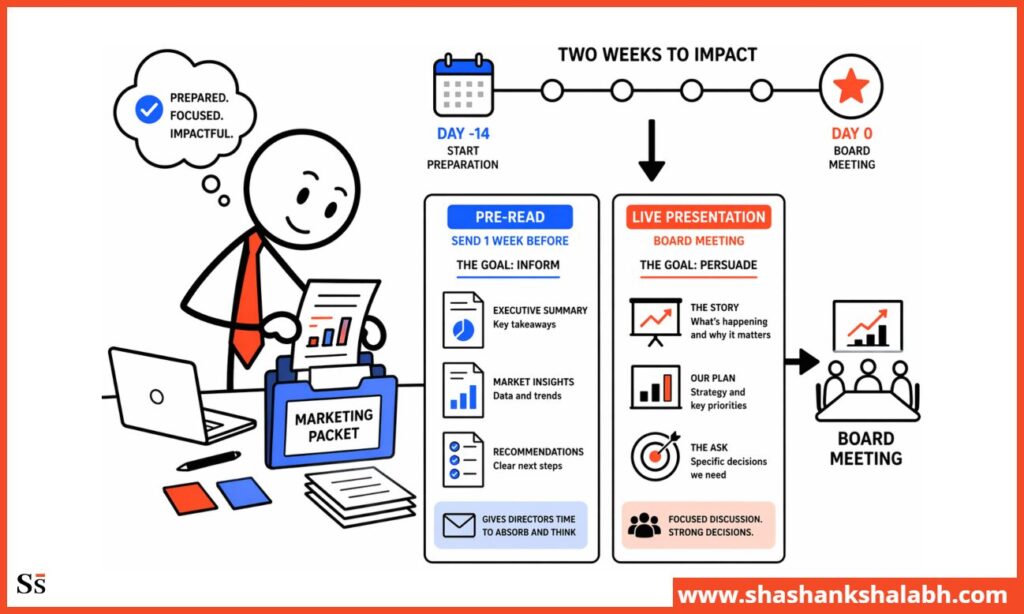
Good board meetings don’t happen in the room. They happen in the two weeks before it.
What to Prepare Two Weeks Before the Board Meeting
Pull trailing 12-month data for all six core metrics:
CAC and CAC payback, LTV:CAC ratio, marketing-sourced pipeline percentage, pipeline coverage ratio, NRR, and MER.
Twelve months of data for each, not just the current quarter.
Write the variance explanation for anything that moved significantly:
Any metric that moved significantly (up or down) needs a written explanation. This should include the root cause, what changed, what the current trend is. Write it before the meeting. Don’t improvise it in the room.
Prepare the “what changed and why” narrative for each metric:
This is the difference between data and insight.
Here is an example of data: “CAC went from $10,000 to $12,000.”
Insight is “CAC went from $10,000 to $12,000 because we expanded paid acquisition into two new channels that are still in the optimization phase. And we expect payback to normalize as the algorithms mature over the next 45 days.”
What to Send in Advance vs Present Live
Send in advance the data packet.
Board members want to review the numbers before the meeting. Include trailing 12-month metrics, variance explanations, and key initiative updates at least 48 hours ahead.
Members who pre-read ask smarter questions and spend less time on basic clarifications.
The narrative, the decisions, and the questions where you need their input should be presented live. The live meeting is for strategic discussion, not data review.
Reading numbers that board members haven’t seen wastes meeting time.
How a Fractional CMO Prepares Board Reporting
A fractional CMO builds the reporting process so board preparation is systematic, not reactive. Twelve-month metric trends are always up to date, not assembled in a rush the week before the meeting.
Variance explanations are written as events happen, not reconstructed from memory. The marketing slide is updated monthly, not rebuilt from scratch each quarter.
Good board prep isn’t a sprint before each meeting. It’s a continuous process.
Companies that treat it as a sprint produce reactive reporting. And those with a fractional CMO managing the process produce proactive reporting, which is the foundation of board confidence.
→ Fractional CMO Responsibilities → Fractional CMO ROI
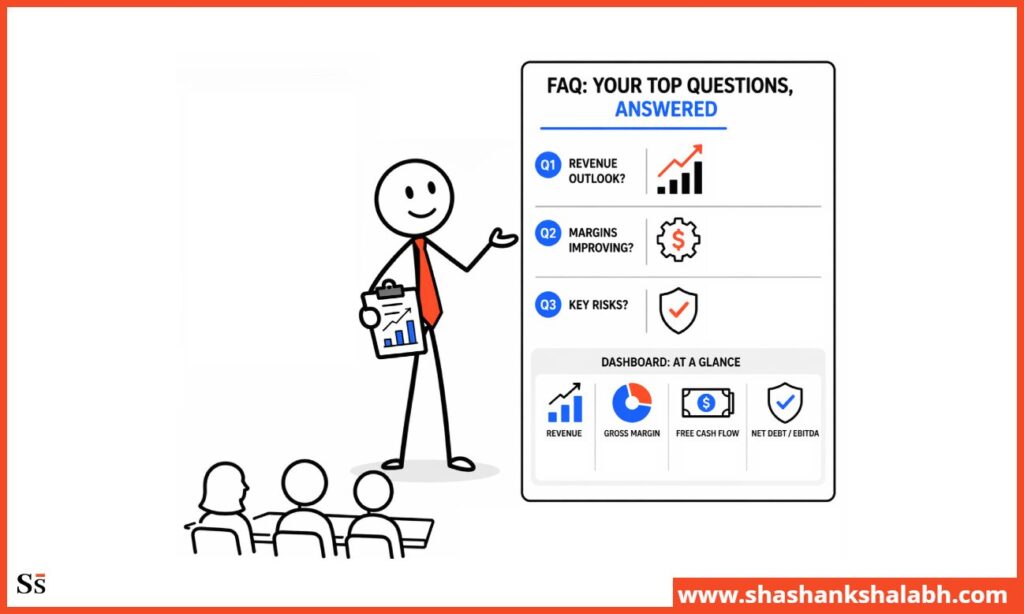
FAQ: SaaS Board Metrics
These questions will help you understand how to present key SaaS metrics to investors.
What marketing metrics do Series A investors care most about?
Series A investors focus on CAC payback (under 18 months and stable), marketing-sourced pipeline (can marketing generate leads without the founder), and LTV:CAC (is the unit economics sound).
They want to see repeatability. Can the company acquire customers systematically, not just through founder relationships and early adopter networks?
How do I present marketing if my numbers aren’t great yet?
Lead with the why, not the apology.
Explain the root cause, your recovery plan, and the leading indicators you’re tracking. Boards care more about your judgment and understanding than a single positive number.
What’s the difference between marketing metrics for a board vs internal tracking?
Internal metrics such as channel CAC, campaign conversions, and content attribution can be granular. Board metrics need to answer one question: is marketing building a capital-efficient growth engine?
Focus on CAC payback, LTV:CAC, marketing-sourced pipeline, pipeline coverage, NRR, and MER. Internal metrics guide tactics; board metrics guide investment.
The board slide should have six numbers maximum. Internal dashboards can have several. You should know which six matter to investors.
How often should I present marketing metrics to my board?
Quarterly: show trailing 12 months for all core metrics.
Monthly: send a one-page dashboard with headline numbers, variance explanations, and leading indicators.
Monthly updates prevent surprises, which is the biggest threat to board confidence.
What does good marketing board reporting look like at Series B?
At Series B, good marketing board reporting shows three things:
- 12-month trend of improving marketing efficiency: CAC stable or falling, LTV:CAC ≥4:1 and rising, MER increasing as spend grows
- Credible attribution model linking marketing spend to closed revenue
- Forward-looking pipeline coverage showing confidence in the next two quarters
The Series B board is evaluating whether marketing can deploy significantly more capital efficiently. That is why the reporting needs to make that case with data, not assertions.

Closing Thought
Founders who present marketing know the story behind numbers: what changed, why, what they did, and what’s next.
Investors listen to the story; the metrics are just proof.
A CAC above target but falling with a clear plan is stronger than a CAC on target with no explanation. A marketing-sourced pipeline under 40% with a plan to hit 50% beats 50% with no visibility.
Know your numbers and why they moved. Know your plan. That’s what investors care about.

Shashank brings over 22 years of global omnichannel marketing experience. As a 4x Chief Marketing Officer, he has helped several organizations (Startups and Fortune 500) drive sustainable revenue growth through strategic marketing.