
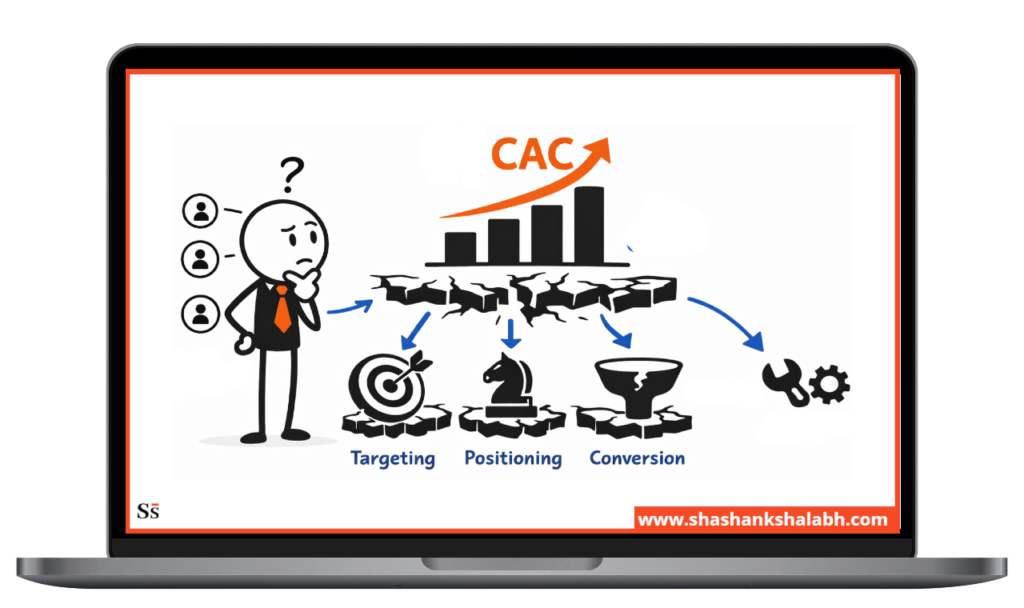
In my marketing career, I have observed that a high CAC (customer acquisition cost) has more to do with targeting, positioning, and conversion, than with channels.
In this guide, I will walk you through the eight most common causes of high CAC in B2B companies, how to diagnose which one is driving yours, and the specific solutions that actually move the number.
Most of these come from my experience working both as a CMO and a fractional CMO for B2B businesses.
What this guide covers:
- How to calculate CAC correctly, and why most companies get it wrong
- The eight causes of high CAC in B2B companies
- A diagnostic framework to identify the primary cause
- A six-step fix sequence in the right order
- Realistic timelines for improving CAC
What Is CAC and Why Does It Matter?
Before you jump into diagnosing why customer acquisition cost is too high, let’s talk about what CAC actually is.
How to Calculate CAC Correctly
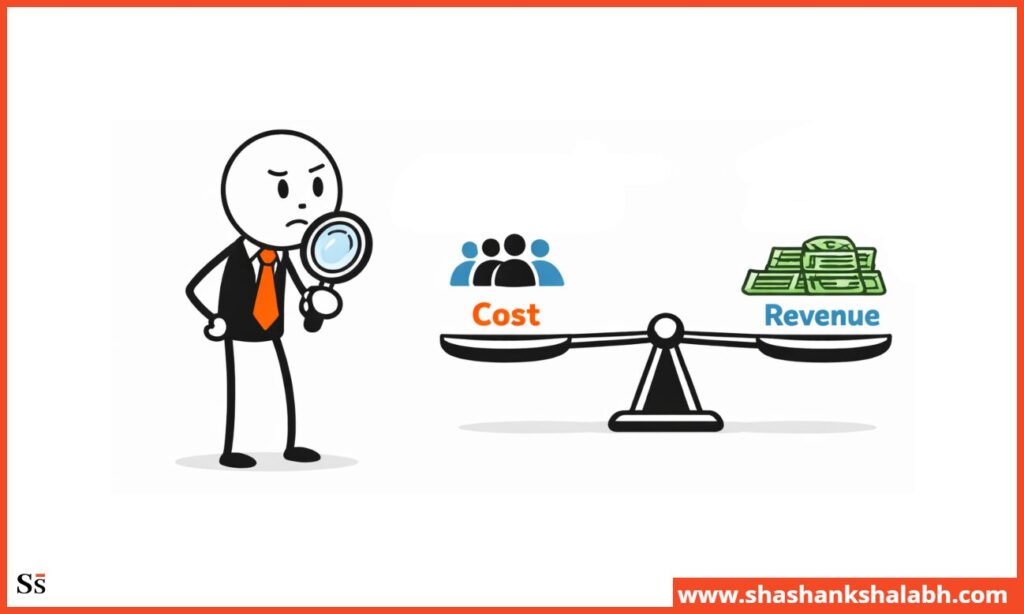
Customer acquisition cost is the total cost of acquiring a new customer.
That means every dollar spent on marketing, sales, and the overhead required to run both functions, divided by the number of new customers acquired in the period.
Here is the correct formula:
(Marketing spend + Sales spend + Related overhead) ÷ New customers acquired = CAC
What gets left out, and shouldn’t:
I have seen businesses calculating their customer acquisition cost using only marketing spend.
They exclude sales salaries, sales tools, sales training, agency fees on the sales side, and management overhead.
The result is a CAC number that looks better than it is. And this misdiagnoses where the cost is actually coming from.
Let me give an example.
If a business spends $50,000 per month on marketing and acquires 10 customers, the marketing-only CAC is $5,000.
However, if total sales costs are another $40,000, the fully loaded CAC is $9,000.
These two numbers lead to very different diagnoses and very different solutions.
What Good CAC Looks Like by Stage?
Customer acquisition cost benchmarks vary by the business-stage. A CAC that’s acceptable at an early stage company is a problem at a growth stage organization.
Early stage ($1M-$5M ARR):
At this stage, CAC volatility is normal.
The company is still finding efficient channels and refining ICP.
Expect inconsistency. Here, your goal is to learn which channels work, and not to optimize customer acquisition cost before the data exists to do it.
Growth stage ($5M-$20M ARR):
For growth-stage businesses, CAC should be stabilizing or declining as channels mature.
The business should know which two or three channels produce the best CAC efficiency. They should be investing in those channels with increasing depth.
Scale stage ($20M+ ARR):
At this stage, the customer acquisition cost should be improving through channel depth, brand efficiency, and the compounding effects of content and reputation.
A company at $20M ARR with the same CAC as when it was at $5M ARR hasn’t built an efficient acquisition system.
B2B SaaS benchmark:
CAC payback under 12 months is healthy.
Under 6 months is excellent.
However, if the payback is beyond 18 months at growth stage, this suggests a structural problem that won’t fix itself with more spend.
Why Rising CAC Is a Leading Indicator of Deeper Problems
I want you to understand this concept.
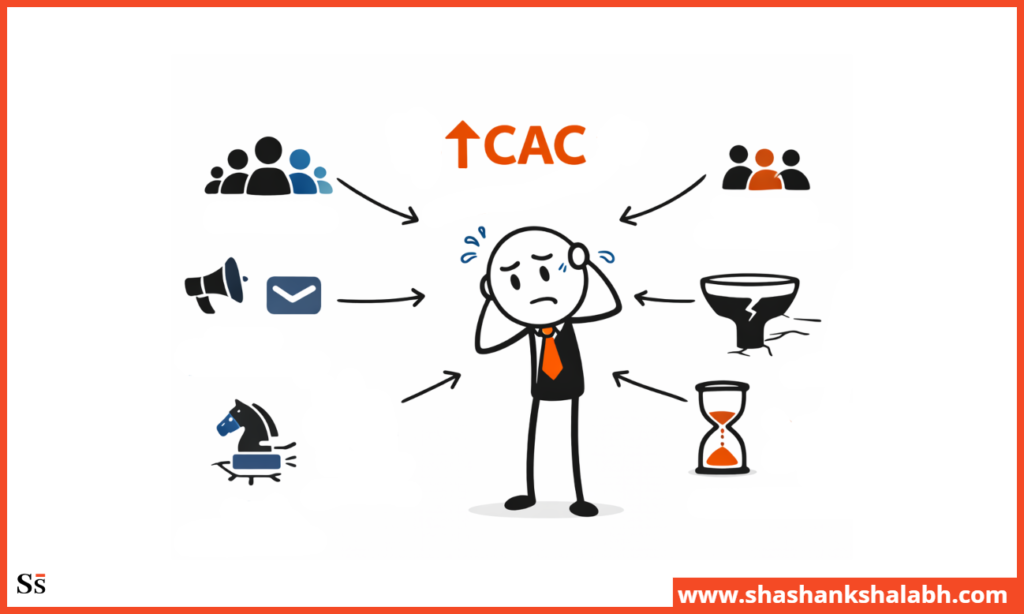
The customer acquisition cost doesn’t rise randomly.
This is a sign that your acquisition system is breaking.
If CAC goes up while LTV stays flat, efficiency drops. You’re paying more for the same return. Your LTV:CAC ratio weakens.
At the growth stage, investors watch this closely. And rising CAC without a clear solution quickly kills confidence.
For more on how boards evaluate CAC, check out this guide on SaaS Board Marketing Metrics.
The 8 Most Common Causes of High CAC
In most cases, high CAC comes from one core issue, with a couple of smaller factors adding to it.
The real challenge is figuring out what’s actually driving it, because the order you fix things depends on that.
Broad ICP
Broad targeting means you’re paying to reach people who will never buy.
Every irrelevant impression, click, lead, and follow up adds cost without adding customers. Don’t think of this as poor marketing. It’s poor audience selection.
Let’s do the math.
If only 5% of leads actually fit your ICP, you’re paying for 20 customers to win one.
Raise that to 25% fit, and the same spend drives 5X conversions at one-fifth the customer acquisition cost.
How will you know if you have too broad an ICP?
In general, high lead volume, low conversion rates, sales team spending significant time on prospects that don’t fit, and a busy pipeline with low win rates suggest you have a broad ICP.
Solution:
Rebuild the ICP from closed-won data. Use firmographics, buying triggers, company characteristics, and organizational dynamics of the fastest-converting, highest-retaining customers.
That’s the profile to target.
Don’t target the broader market the company aspires to eventually serve.
→ Go-To-Market Strategy for Scaling Companies
Weak Positioning
When positioning is vague or generic, buyers don’t recognize themselves.
So you spend more time and money educating and convincing the wrong people.
Strong positioning does that work upfront. When someone lands and thinks “this is exactly what I need,” they convert faster and cheaper.
If it takes multiple emails, a demo, and follow ups to get there, CAC goes up.
How will you know if you have a weak positioning?
Weak positioning means long sales cycles and high cost per opportunity. You will also see prospects who engage but don’t progress.
Solution:
Build positioning so the right buyers recognize themselves immediately, and the wrong ones opt out before they hit sales.
Clear differentiation improves CAC far more than broad capability claims.
Wrong Channels
Not every channel works for every ICP or stage.
Yet, businesses often keep funding channels that worked early, even after they’ve saturated or lost efficiency.
A blended CAC of $8,000 looks manageable until you see one channel at $3,500 and another at $18,000.
One is quietly dragging performance down at 5x the cost.
How will you know if you are investing in the wrong channels?
Rising blended CAC, significant CAC variance across sources, and an equal budget allocation across channels despite uneven performance suggest you might be spending time and money on wrong channels.
Solution:
Break CAC down by channel, not just blended.
Then shift budget toward the lowest CAC channels before adding anything new.
Often the biggest gain comes simply from moving spend from an $18,000 CAC channel to a $3,500 one.
Poor Conversion Rates
Low conversion rates at any funnel stage push CAC up, even with the right targeting and channels.
You’re reaching the right people, but losing them before they convert. Every drop at MQL, SQL, or opportunity level raises the cost per customer.
Common leak points:
- Visitor to lead: weak landing pages, unclear CTAs, too much friction
- Lead to MQL: misaligned qualification
- MQL to SQL: slow follow up or weak handoff
- SQL to opportunity: poor discovery or no urgency created
What are the symptoms?
If, despite decent lead volume, you observe poor conversion rates at one or more funnel stages, or the CAC is high relative to the channel cost, you certainly have conversion-related issues.
Solution:
Map conversion rates at every funnel stage and identify the biggest drop-off.
A 10% improvement in MQL-to-SQL conversion reduces CAC more than a 10% increase in ad spend. It improves efficiency of existing spend instead of adding more to a leaky funnel.
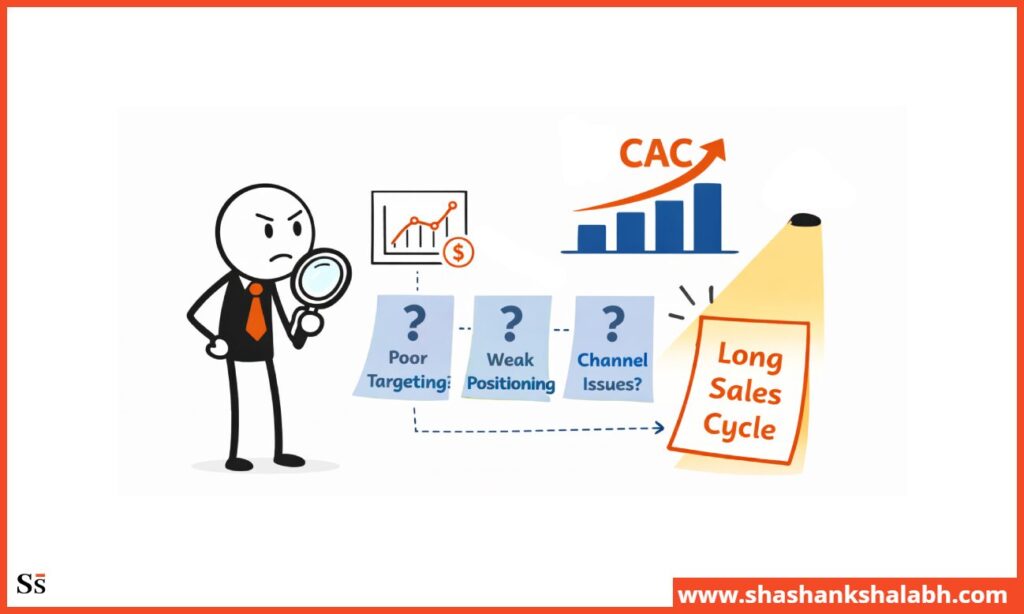
Long Sales Cycles
Every day a deal stays open adds cost. Sales time, marketing nurture, and lost capacity all stack up.
Long sales cycles quietly inflate CAC.
A $6,000 CAC over 60 days is very different from $6,000 over 120 days. You’re using twice the sales effort to win the same customer.
What are the symptoms?
CAC payback stretching beyond 12 to 18 months. Deals sitting mid-funnel for weeks or months. Sales forecasts getting less reliable as timelines drift.
Common stall points and their causes:
- Discovery stall: no urgency to change. Status quo still feels good enough.
- Evaluation stall: objections aren’t handled, and the champion can’t build the case.
- Procurement stall: no strong internal champion to push it through.
Solution:
Identify where deals stall most frequently using CRM stage data.
Build specific programs for content, sales enablement, champion tools to address the stall point directly.
For more on B2B SaaS-specific sales cycle optimization, see Fractional CMO for B2B SaaS.
Marketing-Sales Misalignment
When marketing and sales are misaligned, both spend and capacity are wasted.
Marketing generates leads sales doesn’t prioritize, while sales focuses on self-sourced deals instead of the pipeline.
The result is a broken system. MQLs don’t convert due to weak follow up, conversion rates stay low, and CAC rises as spend increases without output.
Symptom:
MQL to SQL conversion under 20%. Sales mostly relying on self-sourced pipeline. Unworked MQLs sitting in CRM. Marketing and sales reporting different pipeline numbers.
Solution:
Align on a shared MQL definition, set a clear follow-up SLA, and run a weekly joint pipeline review using the same data.
This reduces CAC by fixing the handoff. Marketing stops sending leads into a void, and sales stops ignoring the pipeline that would convert.
Check out this guide on why your lead gen isn’t turning into pipeline to get a better idea.
Wrong Customer Acquisition
Quick churn inflates effective CAC by undercutting LTV.
A CAC that looks fine on paper breaks down if customers only stay six months and never reach expected payback.
When acquisition is optimized for volume over fit, you end up paying for churn. The real cost per valuable customer is much higher than the headline CAC.
Symptom:
High churn in early customer cohorts. Customers who don’t achieve product value within expected timelines. Low NPS scores from recent customers relative to older ones.
LTV:CAC ratio declining despite stable CAC.
Solution:
Break down retention by channel and ICP fit. Some sources consistently produce customers who stick longer than others.
Shift budget toward those segments.
Even if CAC doesn’t change, effective CAC will drop because those customers will stay long enough to pay back the cost.
Scaling Before Efficiency
Putting more budget into an inefficient system just scales the inefficiency.
Rising CAC often triggers more spend, but more volume doesn’t fix weak unit economics.
Let’s look at the math.
An efficient system at $8,000 customer acquisition cost can improve with scale as channels optimize and brand awareness builds.
However, an inefficient system at $8,000 CAC gets worse with scale as its flaws add up instead of fixing themselves.
Symptom: CAC rising proportionally or worse with each budget increase. No improvement in conversion rates as volume grows. Pipeline quality declining as spend increases.
Solution: Stop scaling. Diagnose the inefficiency using the framework below. Fix it. Then scale.
How to Diagnose Which Cause Is Driving Your High CAC
These causes rarely exist alone, but one usually drives most of the problem.
The framework below helps identify the primary issue before you try any solution(s).
Start With the Data You Already Have
Most companies already have the data to understand their CAC problem. They’re just not slicing it the right way.
Pull these four numbers:
CAC by channel:
Which channels are most expensive per customer? The gap is usually bigger than expected and quickly reveals where the budget is being wasted.
Conversion rates by funnel stage:
Where is the biggest drop-off?
Visitor to lead, lead to MQL, MQL to SQL, SQL to opportunity, or opportunity to customer.
The largest drop is the main leak.
Sales cycle length by lead source:
Which leads close fastest?
Channels that close quickly often have lower effective CAC because they use less sales time per customer.
Retention by acquisition cohort:
Which customers stay the longest? That usually points to the ICP segments and channels worth scaling.
The Five Diagnostic Questions
As promised, here are the five questions to help you diagnose the cause for high CAC.
| Question | Likely problem |
| Is lead volume high but conversion low? | Targeting, positioning, or handoff issue |
| Is lead volume low? | Channel selection or ICP definition issue |
| Do leads convert but slowly? | Sales cycle or enablement issue |
| Do customers convert but churn quickly? | ICP fit or onboarding issue |
| Is CAC rising while volume and conversion stay stable? | Channel cost inflation or saturation |
The One Number That Reveals the Most
If you only track one early metric, start with cost per sales-accepted opportunity.
Don’t focus on cost per lead or MQL.
It reflects the real cost of a qualified, sales-accepted opportunity and cuts out unqualified and unworked pipeline noise.
How to use it?
If cost per opportunity is high, the issue is upstream: targeting, positioning, or initial conversion.
However, if cost per opportunity is low but acquisition cost is still high, the issue is downstream: sales cycle, win rate, or execution.
This distinction determines where to fix the system.
Many business (and marketing leaders) try to fix CAC by improving lead gen when cost per opportunity is already low. The real issue is in the sales process, not marketing. That misread can waste months.

The CAC Reduction Playbook: What to Fix and in What Order
The order of fixes matters as much as the fixes themselves.
Even the right solution has little impact if applied in the wrong sequence.
Step 1: Calculate CAC by Channel Before Changing Anything
Blended CAC hides the real problem. Decisions made on it are guesses.
Start with channel-level CAC, even if it’s rough, before changing budget, targeting, or strategy.
Step 2: Tighten ICP Before Increasing Spend
Broad targeting is the most common CAC driver and also the easiest to fix.
Narrowing ICP doesn’t require more budget. You just need better focus of what you already spend.
It’s often the fastest lever, with early gains in 60 to 90 days and full impact over 6 to 12 months.
It comes first because it improves every step that follows.
Step 3: Fix the Biggest Conversion Leak
One funnel stage is usually the main leak.
Fix that first.
Improving the biggest drop-off has more impact than fixing several small ones, because it improves conversion through every stage after it.
Step 4: Align Sales and Marketing on the Handoff
If leads are getting lost at handoff, fixing targeting or positioning won’t move CAC.
Better leads will still disappear in the same gap. Fix sales-marketing misalignment before scaling demand gen.
Step 5: Reallocate Budget to Highest-Performing Channels
Once you see CAC by channel, move budget toward the lowest-cost ones.
Don’t split spend evenly for the sake of balance.
If one channel is $3,500 CAC and another is $18,000, you shouldn’t be funding them equally. Most of the budget should go to the efficient channel, while you rethink or replace the expensive one.
Step 6: Scale
Increase spend only after your customer acquisition cost is improving across the earlier steps.
You achieve efficiency by scaling a tuned system.
Sustainable CAC reduction comes from scaling after improvement, not alongside it.
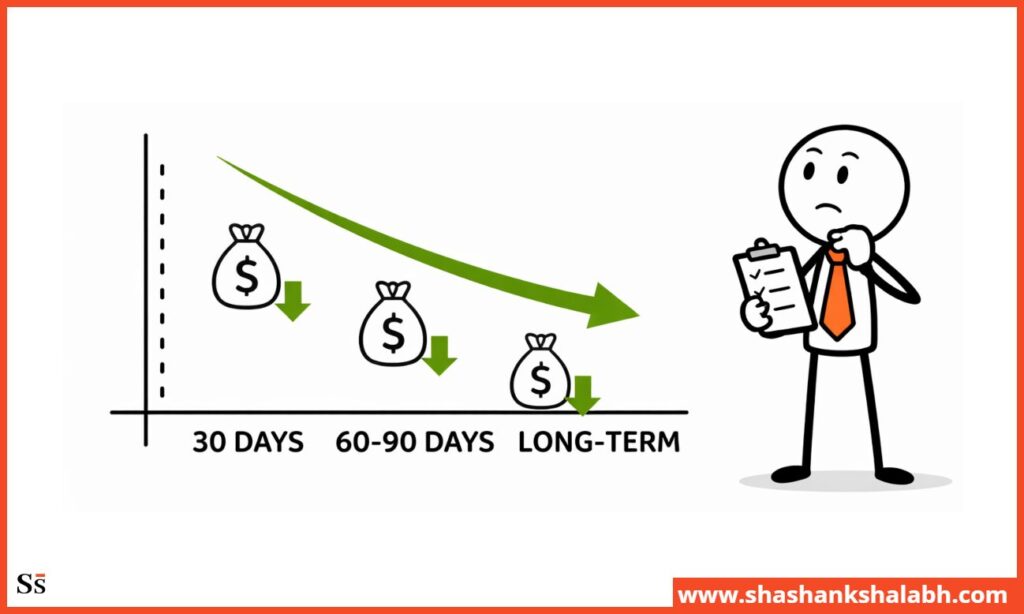
Realistic CAC Improvement Timelines
Don’t expect an immediate improvement in CAC. However, it should also NOT take a year to show progress.
What Changes in 30 Days
ICP tightening shows up fast in targeting. Paid channels start reaching better-fit audiences within the first cycle.
Reallocating budget shifts CAC signals within weeks as mix improves.
Fixing handoffs removes immediate waste. Leads get followed up instead of sitting idle.
These are process changes, and the CAC impact appears in 30 to 45 days.
What Changes in 60-90 Days
Positioning changes start improving conversion as the new messaging reaches the market. Better-fit prospects engage, weaker ones drop off.
Channel optimization improves your acquisition costs as budget shifts to higher-efficiency sources and data builds.
Pipeline quality improves as tighter ICP filters out low-fit deals.
Around 90 days in, Steps 1 to 4 typically bring down CAC by 10-20%. That’s the first clear signal the system is working.
What Changes in 6-12 Months
The real impact builds over time.
ICP refinement, positioning, and channel improvements add up as each one strengthens the others.
Sales cycles shorten as enablement improves and champions have better tools to move deals forward. Retention also improves as better-fit customers stay longer, which improves effective CAC beyond the headline number.
Over 6 to 12 months, a systematic approach generally brings 20-35% drop in customer acquisition costs.
For more on how this improvement translates to ROI, check out this guide on Fractional CMO ROI.
How a Fractional CMO Reduces CAC
CAC is a system problem. Therefore, you need someone who owns the full number. Optimizing individual parts won’t help for long.
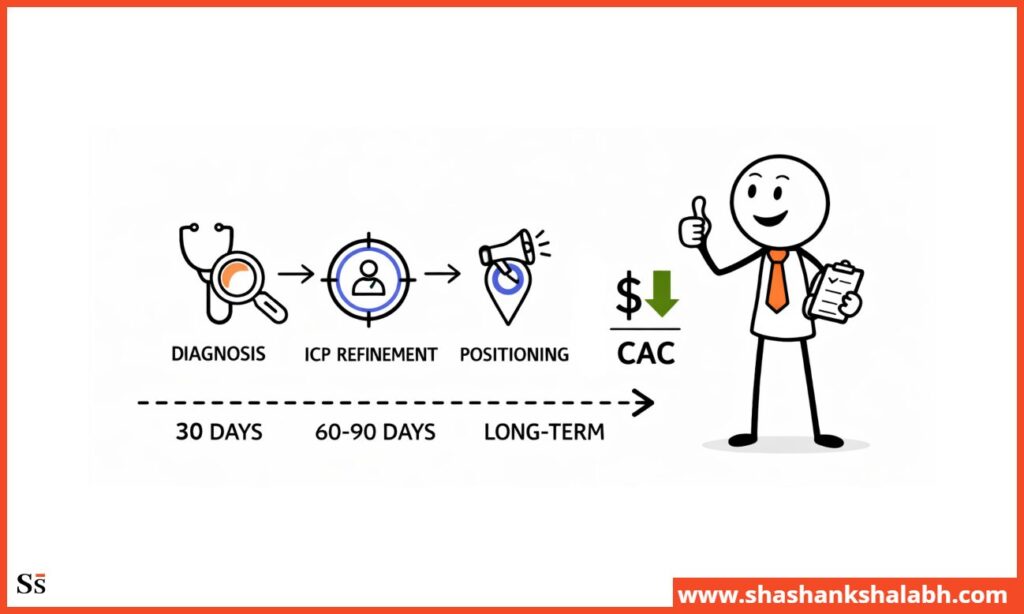
Diagnosis Before Intervention
Most customer acquisition cost problems are misdiagnosed. Teams react to symptoms like more spend or new channels instead of the root cause.
A fractional CMO starts with the data and lets that drive the fix.
Without it, you’re guessing.
The fastest CAC wins come from finding the real issue early and fixing it directly.
ICP and Positioning Work That Most Companies Skip
The right strategy is important to fix high CAC.
ICP tightening and positioning set the foundation.
Strong campaigns on a broad ICP with weak positioning will underperform even average campaigns with a tight ICP and clear differentiation.
Strategy sets the ceiling for everything else.
Accountability for the Number
A fractional CMO owns CAC, not just pipeline or MQLs.
You will observe higher customer acquisition costs in the absence of executive ownership. And when you have clear accountability and board-level reporting, CAC tends to improve.
Explore this post on how a fractional CMO reduces CAC to learn more.
→ Fractional CMO Responsibilities → Fractional CMO Case Studies
FAQ: Why Your CAC Is Too High
What is a good CAC for a B2B SaaS company?
A decent CAC is really about the payback period. It’s how long it takes to earn back what you spent to acquire a customer.
For growth-stage B2B SaaS, under 12 months is healthy, under 6 months is strong, and over 18 months is a red flag.
A higher customer acquisition cost can still be better if it pays back faster. A $15,000 CAC with a 9-month payback is stronger than an $8,000 CAC with a 20-month payback.
How do I calculate CAC correctly?
CAC is total marketing spend plus sales spend and related overhead, divided by new customers in the same period.
The common mistake is counting only marketing spend. That understates the real cost and hides where it’s coming from.
Use fully loaded CAC.
Why is my CAC increasing even though I’m spending more on marketing?
If your aquisition system is broken, spending more will make inefficiency worse.
For example, broad ICP, weak positioning, poor conversion, or broken handoffs all get amplified with scale. Diagnose first, fix the system, then scale what works.
How long does it take to reduce CAC?
You will start seeing early signals within 30 days from ICP tightening, budget shifts, and handoff fixes. In 60-90 days, you can expect a 10-20% improvement in customer acquisition cost.
On average, it takes 6-12 months to realize 20-35% CAC improvement.
What is the relationship between CAC and LTV?
LTV:CAC ratio shows whether the business model works at scale.
For B2B SaaS, 3:1 is the minimum healthy level. 4:1 to 5:1 is strong at the growth stage. Above 5:1 usually means you can safely invest more in growth.
Lowering CAC improves this directly. A 35% CAC reduction can move a 3:1 ratio to about 4.6:1. That shift often changes the conversation from risk to growth.

Closing Thought
A high CAC shouts out loud that the acquisition system is broken.
Trying to address this by cutting spend or adding more channels won’t help for long.
You need to fix the ICP, improve positioning, and align the system so spend reaches the right buyers with the right message.
→ When should you hire a Fractional CMO?

Shashank brings over 22 years of global omnichannel marketing experience. As a 4x Chief Marketing Officer, he has helped several organizations (Startups and Fortune 500) drive sustainable revenue growth through strategic marketing.