
As a fractional CMO, I have worked with dozens of B2B SaaS businesses.
And this example came up during one of my mentoring sessions.
For those who are unfamiliar, I mentor senior-level marketers to help them advance in their career. This also helps me stay updated with recent trends.
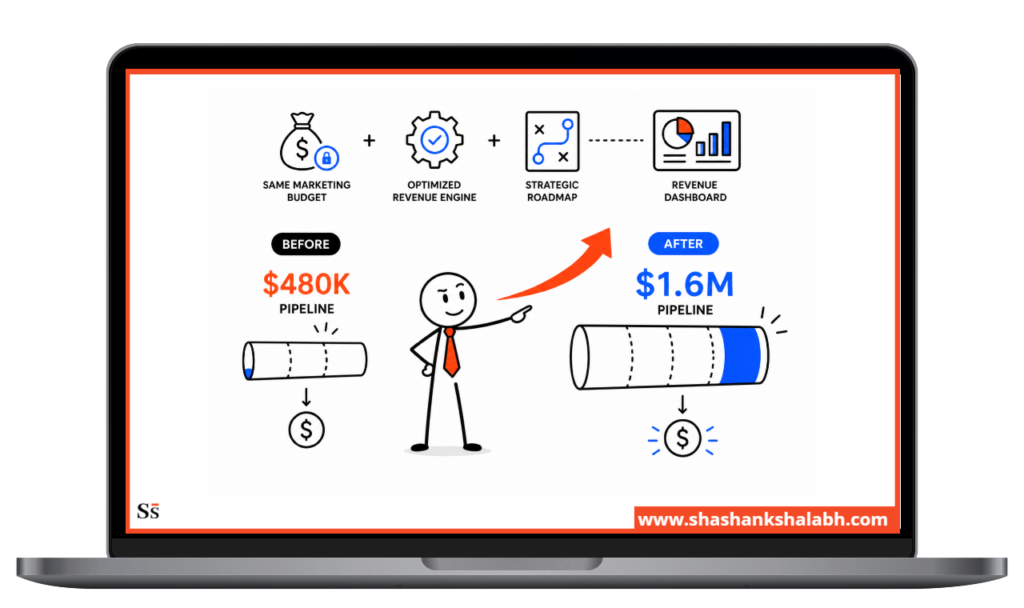
In this B2B SaaS case study, I will discuss one of my fractional CMO engagements, where I took a B2B SaaS company from $480K to $1.6M in monthly pipeline in 6 months, without increasing total marketing spend.
What’s unique about this example is that the changes I implemented were far from tactical.
We did not launch new channels or bring in external vendors (agencies).
Still, we were able to 3x the pipeline.
What this B2B SaaS case study covers:
- The starting situation: what the data showed vs. what the CEO believed
- Five broken pieces diagnosed in the first 30 days
- The six-month fix sequence
- Results after Month-6: pipeline, CAC, conversion, sales cycle
- What you can learn from this case study
Note: For this B2B SaaS case study, Company details and specific figures have been modified to protect client confidentiality. The outcomes, fix sequence, and improvement percentages reflect the original engagement results.
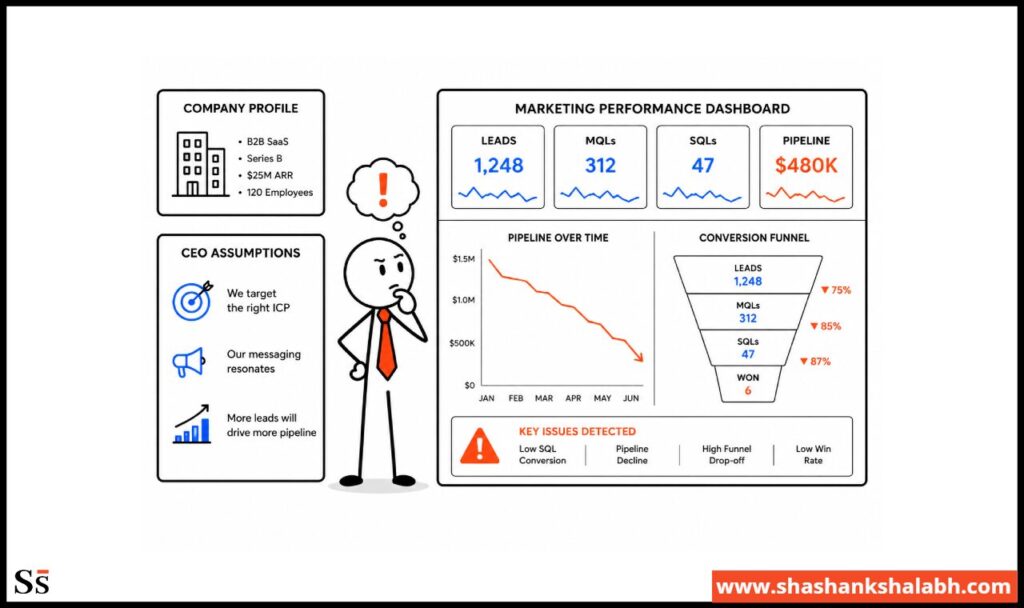
The Situation at the Start
The Company Profile
When I started the fractional CMO work with this B2B SaaS business, they were at $6.2M ARR.
The team was 14 people in total, comprising 2 marketers and 5 salespeople.
They were spending $35K monthly on marketing, across paid acquisition, content, and one agency retainer.
The growth pattern was $5M-$6M ARR for 18 months. They were growing but slowly and inconsistently.
The business had strong product retention. Customers who bought stayed and expanded.
The problem was getting new customers in the first place, and doing it consistently enough to reach the next revenue threshold.
What the CEO Believed the Problem Was
During my initial call, the CEO shared that they needed more leads.
They had considered increasing the budget to drive paid acquisition, content, and outbound.
They were also blaming their paid acquisition agency for the flat pipeline. The CEO also mentioned (multiple times) that sales need to close faster.
Spoiler alert: When I reached my diagnosis, none of these was true. More on this in the upcoming sections.
What the Data Actually Showed
I spent the first two weeks pulling the actual numbers.
| Metric | Actual figure |
| Monthly MQLs | 340 |
| MQL-to-SQL conversion | 11% |
| SQLs per month | 37 |
| SQL-to-opportunity conversion | 28% |
| Opportunities per month | 10 |
| Average contract value | $48,000 ACV |
| Monthly pipeline created | $480,000 |
| Actual new ARR per month | $85,000 |
| CAC | $18,500; rising QoQ |
Assuming a 3:1 healthy pipeline coverage, $480K in monthly pipeline should support approximately $160K in new monthly ARR.
Their ARR ($85K) was half of what the pipeline should have been producing.
Look at the data again. 340 MQLs per month does not show issues with lead volume.
The pipeline was thin because 11% of those 340 MQLs were becoming sales-qualified.
The real issue was what was happening post lead generation.
Diagnosis: What was actually broken?
A deep-dive into their data, and conversations with the CEO, sales, and marketing, helped me find these five issues with this B2B saas business.
ICP Was Targeting Companies Instead Of Buying Triggers
The business had their ICP targets as “B2B SaaS companies with 50-500 employees.”
Read that again.
This defined the market segment, but not the buyer.
When we analyzed their 24-month closed-won data, we found that 78% of won deals were companies that had closed a Series A or B round in the previous six months.
And in most of those deals, a new VP of Sales had been hired within the three months prior to the purchase.
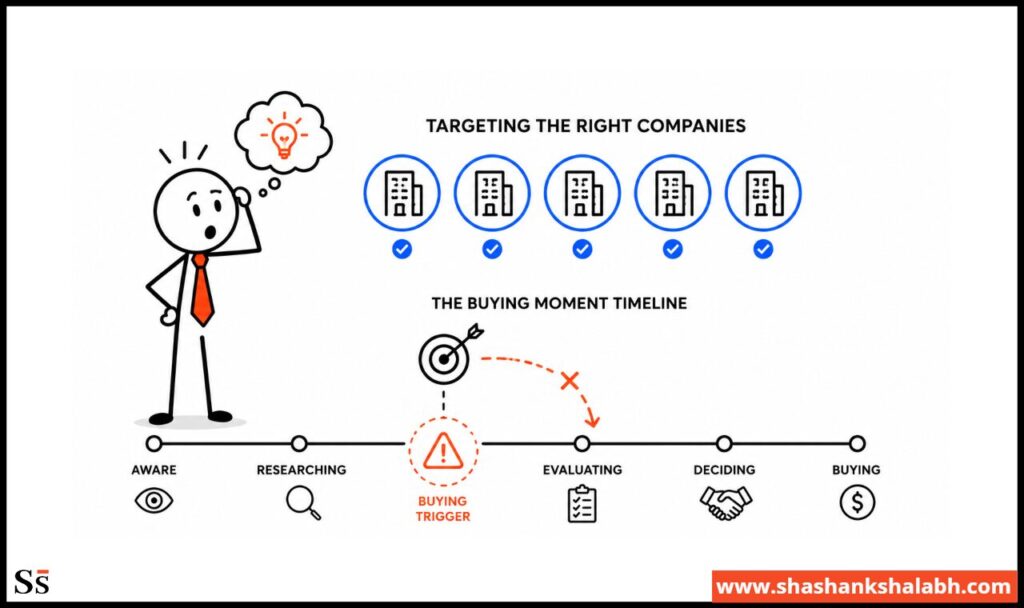
We understood that the real ICP was “B2B SaaS companies 3-12 months post-Series A or B with a recently hired VP of Sales.”
The combination of fresh funding, new sales leadership, and the organizational pressure to build the pipeline quickly was the buying trigger.
This business had a broad ICP and the buying trigger was completely absent from targeting. Marketing was reaching the right industry, at the wrong moment.
Positioning Was Category-Generic
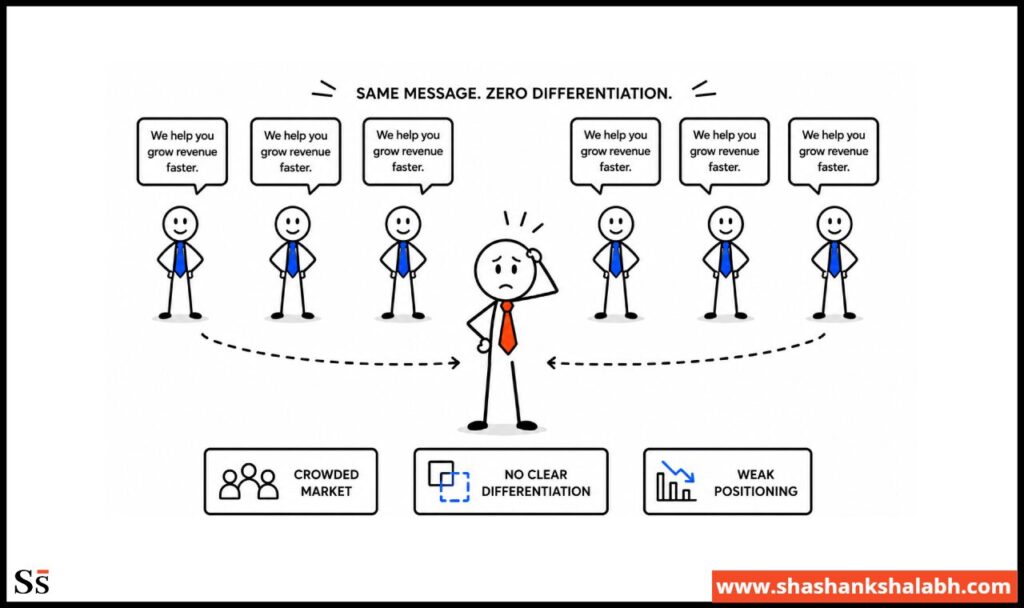
Two phrases were common across their homepage and ad copy: “streamline your marketing operations” and “drive more pipeline.”
Doesn’t everyone say this?
There was no reason for a buyer to prefer this product based on how it was positioned.
We interviewed closed-won customers; and found that buyers consistently said they chose the product because it integrated natively with their specific sales stack in a way competitors didn’t.
That specific technical differentiator was the reason 78% of closed-won customers bought.
It appeared on page three of the website, buried beneath three screens of generic capability claims.
The actual reason buyers chose was invisible in the marketing.
Generic positioning was doing the work instead, and as expected, was failing.
The Handoff Was Destroying Qualified Leads
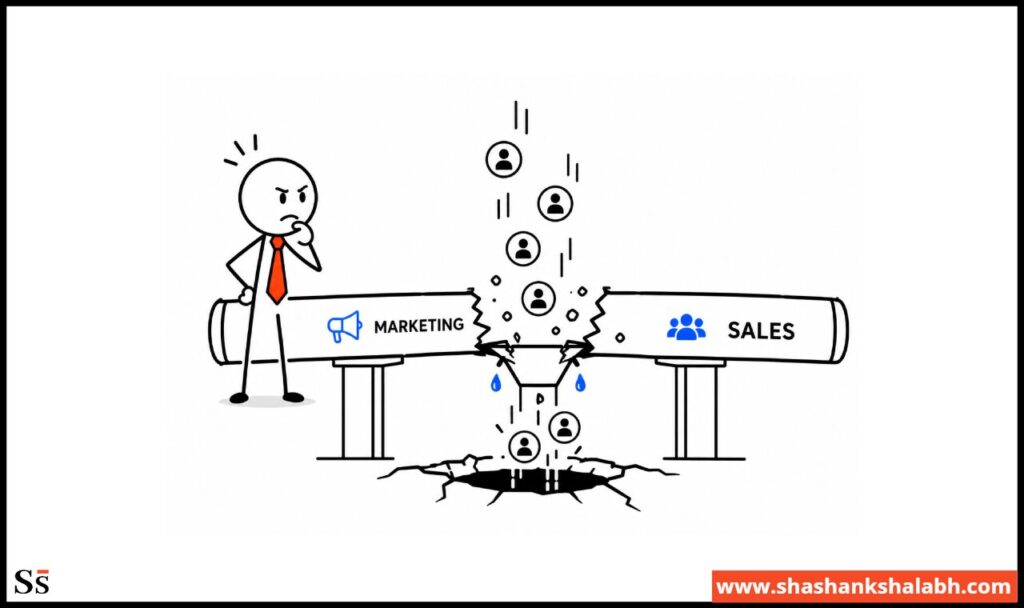
The MQL-to-SQL conversion rate was a mere 11%.
This made us curious what happened to leads between MQL status and sales contact.
When we looked into the data, we found that the average time from MQL to first sales contact was 4.2 days.
And the % of MQLs never contacted at all stood at 43%.
Sales had deprioritized marketing leads because ‘they were never any good’. Slow follow-up made warm leads cold before sales evaluated them
The handoff was destroying leads before sales had a realistic chance to work them.
Content Was Attracting the Wrong Audience
Here is their top organic content pieces by traffic volume:
- “What is demand generation”: 4,200 monthly sessions
- “Marketing funnel template”: 3,800 monthly sessions
- “B2B lead generation tips”: 2,900 monthly sessions
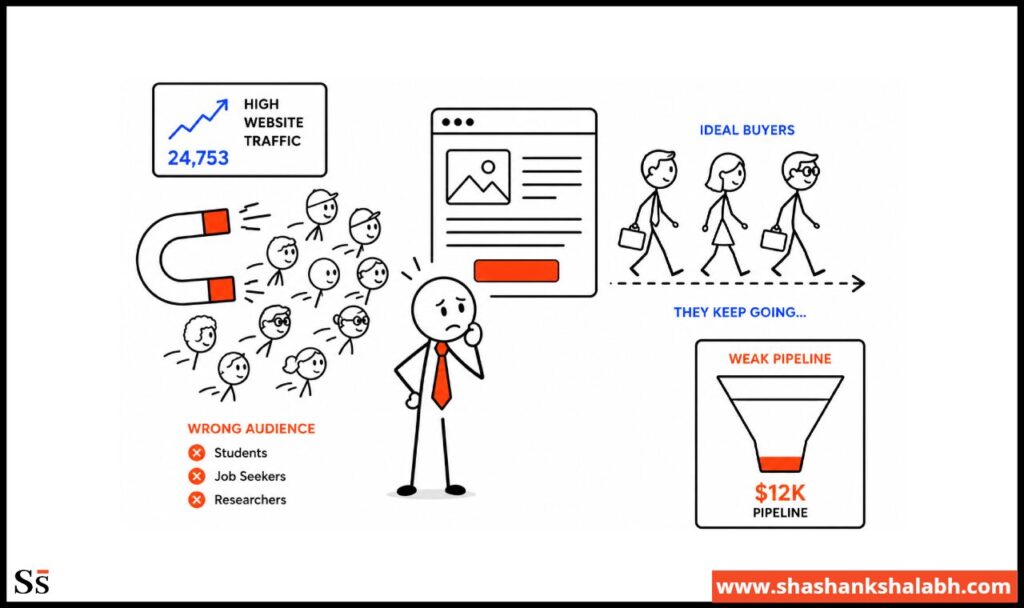
These were attracting marketing managers and junior practitioners researching general topics. The actual buyers (post-Series A founders and newly hired VPs of Sales evaluating pipeline tools) weren’t searching these terms.
They were searching things like “pipeline tool for Series A startup” and “how VPs of Sales build pipeline in first 90 days.”
The content engine was optimized for traffic volume and broad SEO reach. It was producing sessions without producing buyers.
In other words, high traffic, wrong audience, and zero pipeline contribution from the top organic content.
Marketing Was Measured on MQL Volume, Not Revenue Contribution
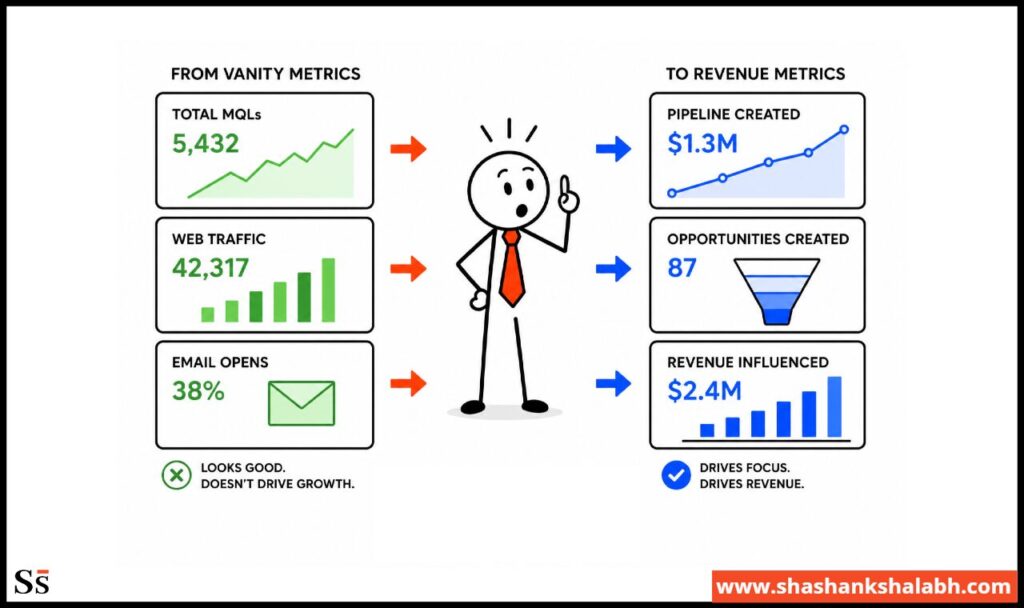
When I started the engagement, marketing was hitting monthly targets for MQL (300), content (8 pieces), and email open rate (25%). And still, the business was missing its growth goals.
This is because the volume and activity metrics had no connection to pipeline or revenue outcomes.
How We Addressed These Issues
It took us six months to solve these five issues.
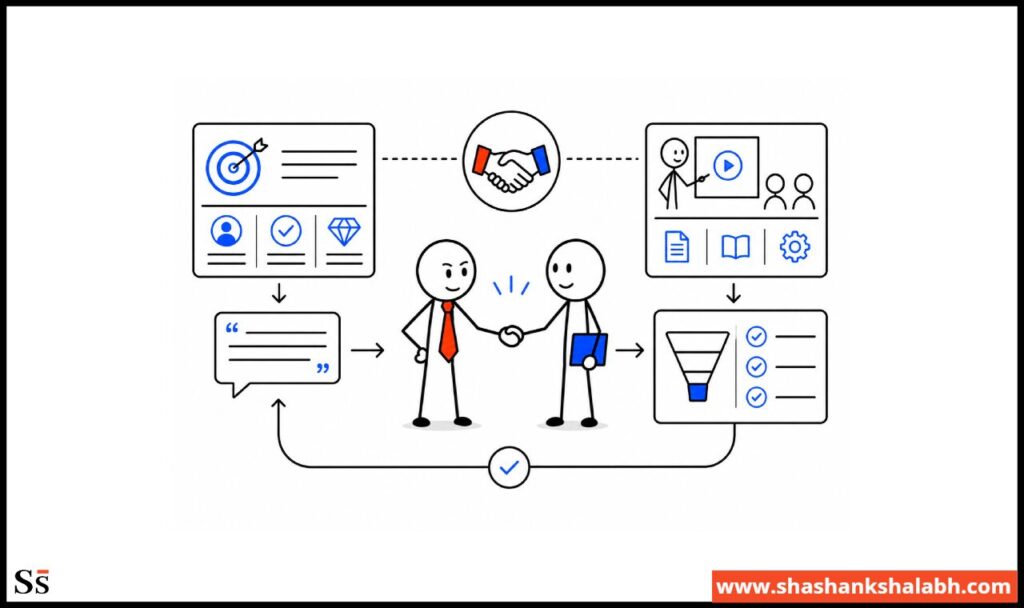
Month1: ICP Rebuild and Measurement Reset
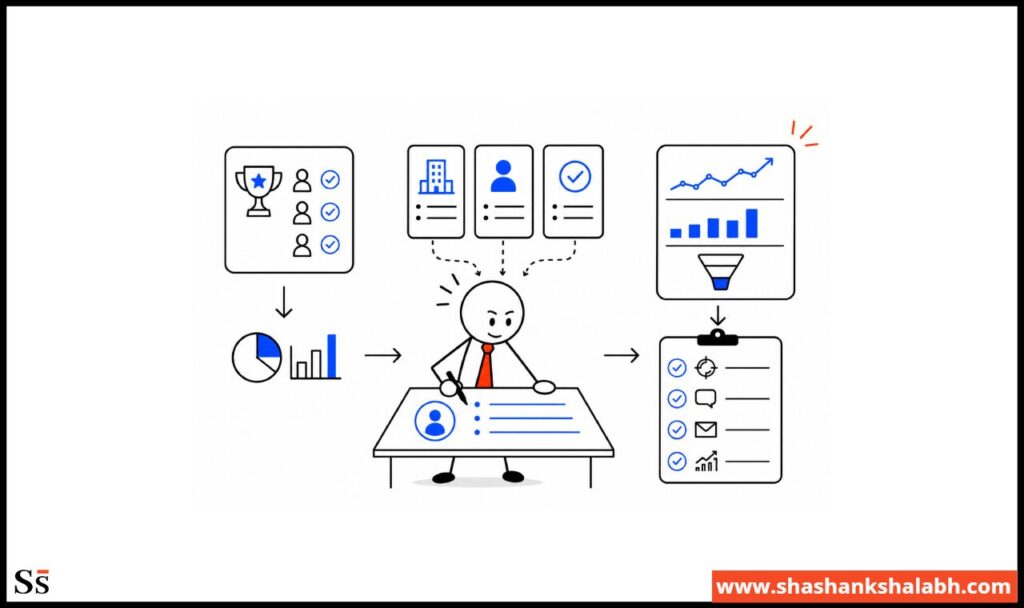
Weeks 1–2: Closed-won analysis
We pulled 24 months of won deals, and identified the Series A/B plus new VP Sales pattern. We confirmed it held across deal size, geography, and product vertical.
The buying trigger was consistent and documentable.
Week 3: Rebuilt ICP criteria
We added funding stage (Series A or B closed within six months) and hiring trigger (new VP of Sales in the last 90 days) as primary targeting signals.
These were filterable in LinkedIn targeting and trackable through intent data tools.
The ICP became specific enough to act on.
Week 4: Replaced marketing KPIs.
We removed MQL volume, content volume, and email open rate as primary metrics.
And replaced these with MQL-to-SQL conversion rate, pipeline contribution in dollars, and marketing-sourced revenue percentage.
Result
MQL volume fell 40% after we tightened targeting.
We went from 340 MQLs producing 37 SQLs to 200 MQLs producing 50 SQLs. Now we had fewer leads, but better outcomes.
Month 2: Positioning + Handoff Fix
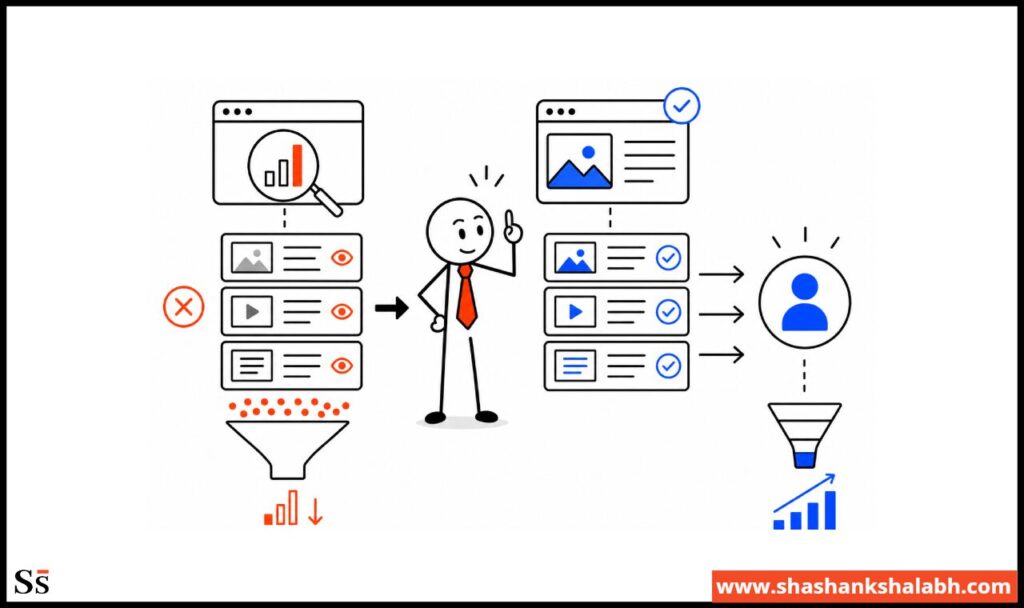
In the first two weeks, we shifted the positioning to focus on our native integration.
The new headline was: “The only pipeline tool with a native integration for [specific sales stack]. It just works with the tools you already use.”
We led with that message everywhere; on the homepage, in ads, emails, and the sales deck. It put the biggest reason customers bought right up front.
We moved on to addressing the handoff process in the third week.
High-score MQLs were followed up within 24 hours, and standard MQLs within 48 hours.
CRM alerts flagged leads that hadn’t been contacted. Marketing and sales also started a weekly pipeline review to look at the same data, use the same definitions, and agree on the same numbers.
During week-4, we trained the sales team on the new ICP and positioning. They learned what signals to look for, how to spot the right buying triggers, how to qualify faster, and how to start conversations with prospects like a VP of Sales who’s new in the role.
All these efforts improved the MQL-to-SQL conversion from 11% to 19% within three weeks of fixing the handoff process.
This happened before the positioning changes had time to fully take effect. Improving response time and follow-up created the fastest impact, increasing conversion from the same leads.
Month 3: Content Strategy Rebuild
Audit:
We reviewed every existing content piece against the new ICP.
We looked at which content attracted post-Series A founders and VPs of Sales versus marketing practitioners.
We found that about 5% of our content reached the right audience, while 95% was attracting the wrong people.
Repurpose:
We updated six high-traffic pieces that were attracting the wrong audience with ICP-specific messaging, examples, and CTAs.
The traffic was already there. We focused on turning that existing attention into interest from the right buyers.
New content:
We build four pieces specifically around the buying trigger:
- “What to look for in a pipeline tool after Series A”
- “How new VPs of Sales build pipeline in the first 90 days”
- “Pipeline tool evaluation checklist for Series B companies”
- “The integration question to ask every pipeline tool vendor”
These pieces had lower search volume than our top-performing content, but they targeted the right moment.
We focused on the three to six months after a funding round or VP of Sales hire, when buyers were most likely to start evaluating solutions.
Early impact:
Organic traffic didn’t change much in month three because SEO takes time to show results. But lead quality improved right away.
Leads coming from the new content converted to MQL-to-SQL at 28–34%, compared to the 11% baseline from the old content.
Month 4: Channel Reallocation
We recalculated CAC by channel using the new ICP as the filter.
The difference was significant:
| Channel | CAC (new ICP applied) |
| Paid search (buying-trigger keywords) | $8,200 |
| LinkedIn (Series A/B + VP Sales targeting) | $6,800 |
| Agency-managed broad display | $31,000 |
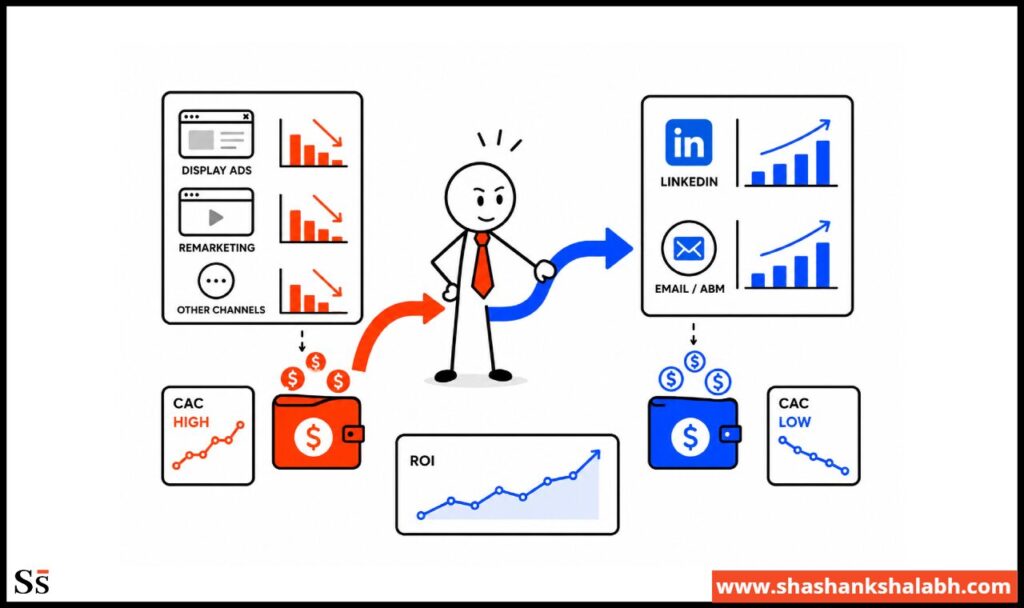
Display ads were taking up 30% of the monthly budget while producing a CAC 4X higher than LinkedIn campaigns targeting the right ICP.
The overall blended CAC of $18,500 hid the difference. Looking at CAC by channel made the problem clear.
Reallocation:
We moved 70% of the display budget to LinkedIn with ICP targeting.
Paid search stayed in place, but we tightened the keywords around buying triggers like “pipeline tool post Series A,” “VP of Sales tools,” and “CRM pipeline management Series B.”
Month 4 pipeline:
Pipeline increased to $890,000 from $480,000 at the start of the engagement.
The channel reallocation alone drove an 85% pipeline increase before the new content had time to rank.
Month 5: Nurture and Re-Engagement
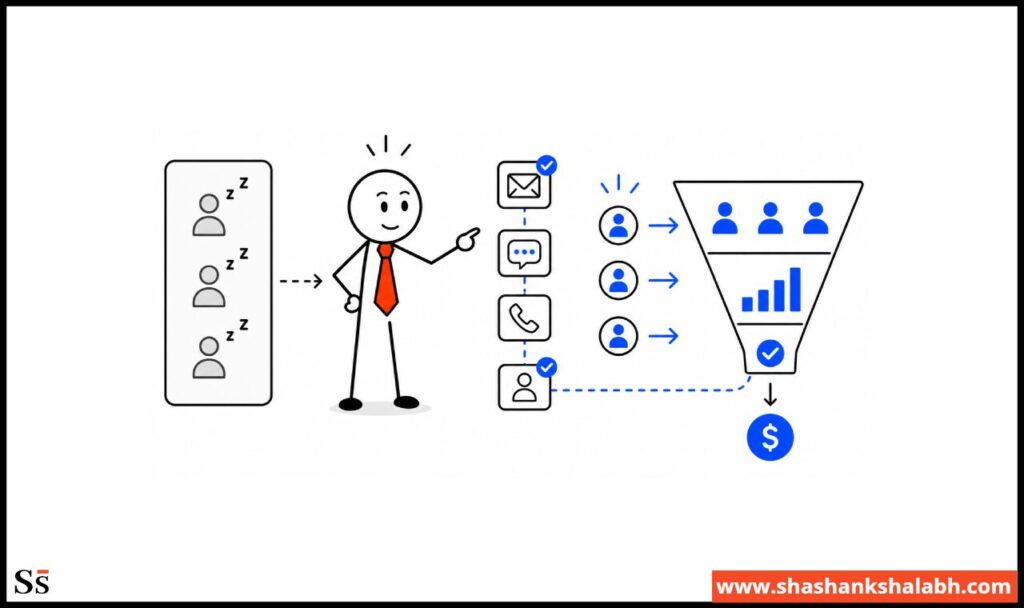
Nurture sequences:
We built this for ICP-fit leads that weren’t ready to buy right away.
The six months after a Series A or B close is often when buying decisions happen.
Leads that matched the ICP but weren’t sales-ready entered a nurture sequence designed to keep us visible and build trust during that window.
Re-engagement
We pulled 340 past leads from the CRM that matched the new ICP but had been marked cold or never worked.
Many of them came from 6-18 months earlier, before we refined the ICP. We launched a targeted re-engagement sequence to reconnect with them.
Result:
23 of the 340 leads re-engaged and moved into active sales cycles.
We created pipeline from leads we had already paid to acquire, without additional acquisition spend. The cost to re-engage these leads was effectively zero.
Win/loss analysis:
The first quarterly win/loss review uncovered a positioning gap in mid-market accounts.
A competitor had recently updated their messaging, which exposed where we were falling behind. We updated our messaging to close the gap before it impacted win rates further.
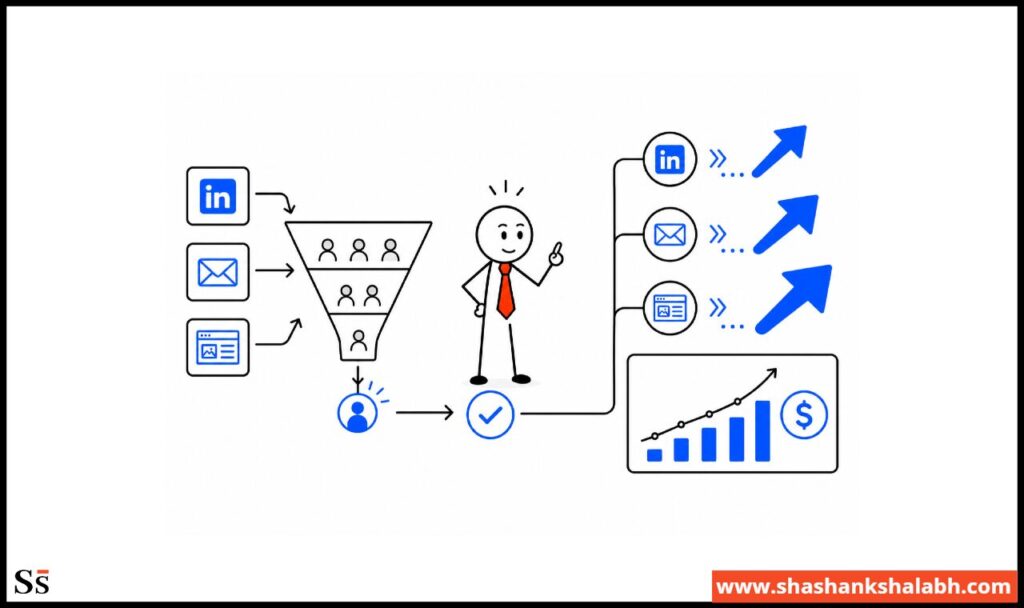
Month 5 pipeline: $1.2M
Month 6: Scaling What Was Working
With the system working, we scaled what was already proving effective.
By now, we had stabilized conversion rates and validated the ICP against new closed-won data; and channel CAC was clear.
We increased LinkedIn spend by 40% because it was the lowest-CAC channel.
We also launched an outbound sequence targeting companies that matched the ICP and had just announced Series A or B funding, reaching out within days of the buying trigger.
The content from month three started ranking for lower-competition, high-intent keywords. Organic qualified leads began entering the pipeline as a new source, creating growth without additional spend.
Month 6 results:
| Metric | Month 1 | Month 6 | Change |
| Monthly pipeline | $480,000 | $1,600,000 | +233% |
| MQL-to-SQL conversion | 11% | 31% | +182% |
| CAC | $18,500 | $9,200 | −50% |
| Marketing-sourced revenue | ~18% | 43% | +139% |
| Average sales cycle | 94 days | 67 days | −29% |
| Monthly marketing spend | $35,000 | $39,200 | +12% |
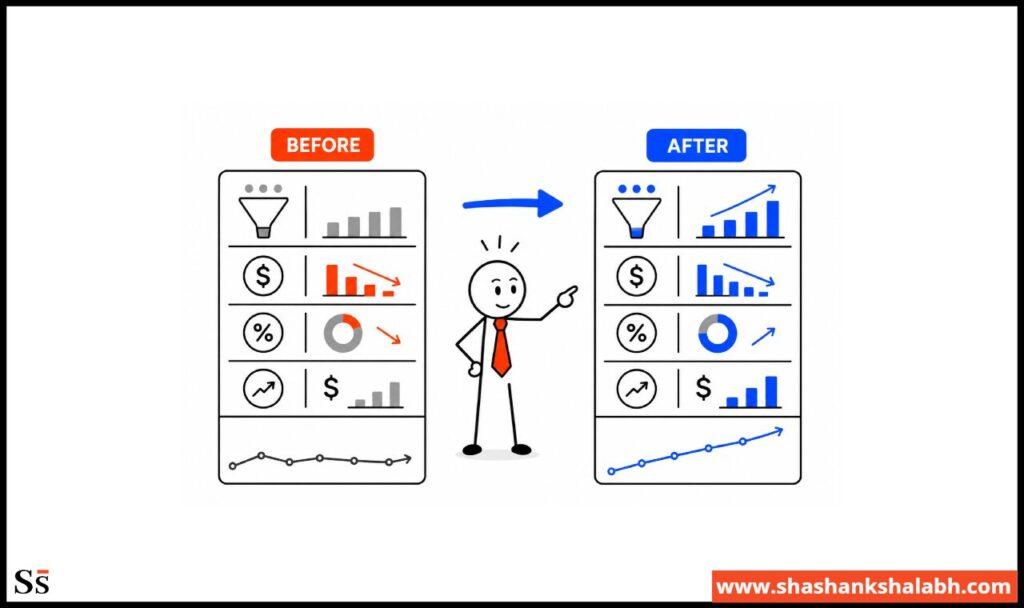
Pipeline tripled. Spend increased 12%.
What the Numbers Show at Month Six
Pipeline Comparison
- Month 1: $480,000 in monthly pipeline created
- Month 6: $1,600,000 in monthly pipeline created
- Change: +233%: That’s a 3.3x in six months
- Marketing spend increase: $4,200 per month. That’s a 12% increase that produced a 233% pipeline increase
The pipeline improvement was not proportional to spend because the improvement came from fixing conversion efficiency.
Efficiency Comparison
Every key efficiency metric improved simultaneously:
- CAC: $18,500 → $9,200 (-50%)
- MQL-to-SQL conversion: 11% → 31% (+182%)
- Marketing-sourced revenue: 18% → 43% (+139%)
- Sales cycle length: 94 days → 67 days (-29%)
When the ICP is clear and the positioning is specific, the right buyers move faster.
The 29% reduction in sales cycle length came from better marketing. Buyers who fit the ICP need less education and face fewer objections during evaluation.
What Didn’t Change
When I share this B2B SaaS case study with businesses, they often ask what new resources were added.
- Marketing headcount: Still 2 marketers
- Total marketing budget: Increased by $4,200 per month (12%)
- Channels: Paid search, LinkedIn, content
- Agency: Same agency but with a defined scope and new performance metrics
The improvement came from fixing the underlying system.
The same two marketers produced a 3x pipeline by executing against a better strategy. The agency cut CAC in half by working from a clear ICP and using the right targeting parameters.
The 6 Lessons From This Engagement
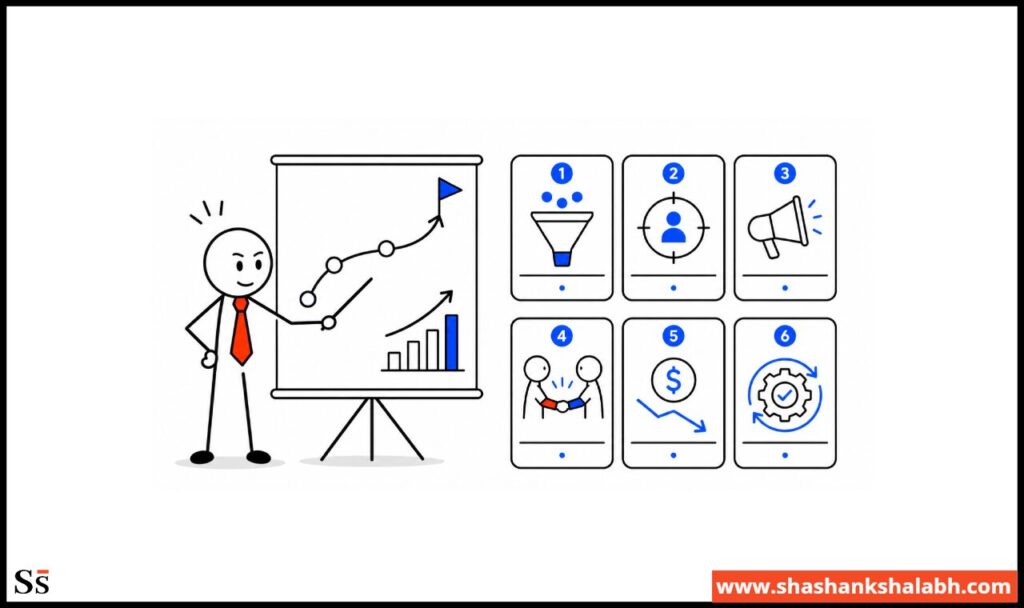
Let me share the key lessons from this B2B SaaS case study.
The Buying Trigger Is More Important Than the Firmographic Profile
“B2B SaaS, 50–500 employees” is a market segment. It describes a large population of companies with very different buying timelines and motivations.
“B2B SaaS company, three months post-Series A, new VP of Sales just hired” is a buying moment.
It describes a company under specific organizational pressure to solve a specific problem right now.
Targeting buying moments drives higher conversion because the timing is right. The urgency, budget, and need are already there when buyers enter the conversation.
Positioning Should Lead With the Reason Buyers Actually Chose You
The homepage said “streamline your marketing operations.” But buyers chose us because of the native integration. Those are two different messages.
Talk to your last ten closed-won customers.
Ask one question: why did you choose us over the alternatives?
Their answer should become the homepage headline, not a generic capability claim that every competitor makes.
Most companies lead with what sounds impressive instead of what actually drives buying decisions. The result is messaging that sounds good but converts poorly.
The Handoff Is Where Most Pipeline Is Destroyed
43% of MQLs were never contacted. The average time to first contact was 4.2 days.
This is one of the most common issues behind pipeline problems, and broken handoffs are often one of the biggest sources of lost opportunities.
The fix is operational.
Define an SLA, set up CRM alerts for untouched MQLs, and create a weekly marketing and sales pipeline review.
You don’t need new tools or headcount. The solution is clear ownership and accountability.
Fix the handoff before blaming lead quality.
Content Volume Without ICP Alignment Does Not Build Pipeline
Eight content pieces per month targeting marketing practitioners generated zero qualified pipeline.
But, two pieces per month targeting post-Series A founders and VPs of Sales created qualified opportunities within weeks of ranking.
Content should be measured by pipeline impact, not traffic, shares, or volume.
A piece generating 500 sessions from the right buyers is more valuable than one generating 5,000 sessions from the wrong audience.
Measure what content creates, not just what it attracts.
CAC by Channel Reveals Budget Decisions That Blended CAC Hides
We found a major gap in channel performance.
Display advertising was driving a $31,000 CAC, while LinkedIn with proper ICP targeting was producing a $6,800 CAC. The blended CAC of $18,500 hid this difference for months.
Channel-level CAC should drive budget decisions.
Otherwise, teams end up optimizing for lead volume instead of understanding which channels actually create revenue at the lowest cost.
Calculate CAC by channel before making changes. Once you see the numbers, the right allocation decisions become much clearer.
Fix the System Before Scaling Spend
Every dollar added in month one would have produced a $18,500 CAC. The same dollar added in month six produced a $9,200 CAC.
We did not touch the budget. We worked on the underlying system. And the same investment generated twice the output.
Scaling before fixing the system only scales the inefficiency.
When revenue is flat, the instinct is often to add more budget, more channels, or another agency.
Organizations that fix the system first and scale second consistently get better results at a lower cost.
For more on why this sequence matters, check out this post: More Leads Won’t Fix Your Business.
How to Apply This to Your Business
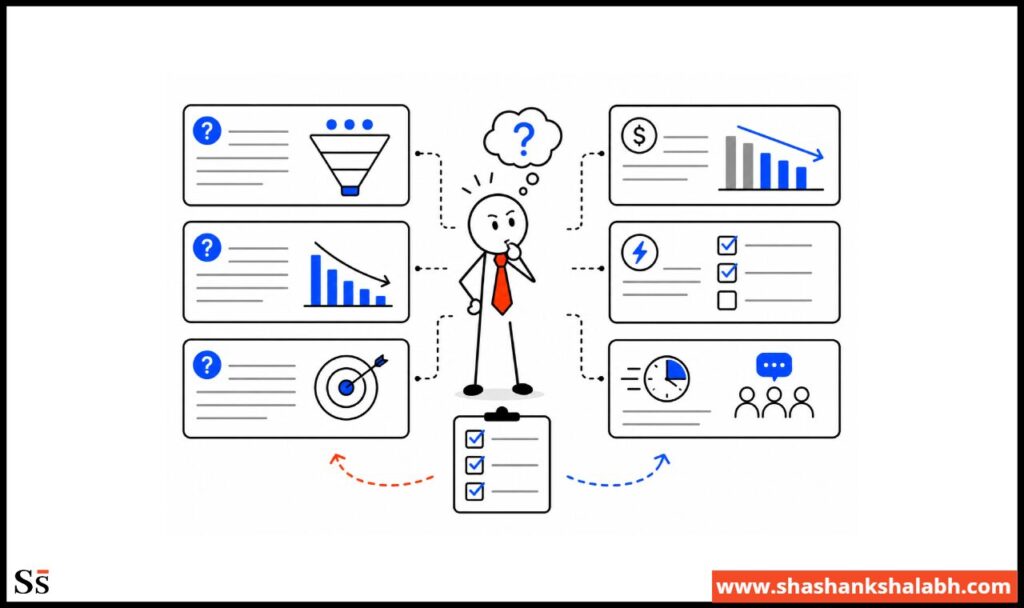
Here are four questions to help you identify the primary problem
What is your MQL-to-SQL conversion rate?
If below 20%, the handoff is broken, the ICP is producing wrong-fit leads, or both. This is the single most revealing metric in the system.
What is your CAC by channel?
If you don’t know your CAC by channel, not just the blended CAC, calculate it before changing anything else. Once you see the difference between channels, the right budget allocation decisions become much clearer.
What is the buying trigger for your best customers?
Stop looking only at industry or company size.
Find the specific moment that pushed your best customers to evaluate a solution: a new hire, a funding round, a business change, or a problem they needed to solve.
If you don’t know what that moment is, interview ten closed-won customers this week.
What percentage of MQLs are contacted within 24 hours?
If it’s below 80%, fix the handoff before changing anything else. Improving response time and follow-up alone can increase MQL-to-SQL conversion within weeks.
The Sequence That Works
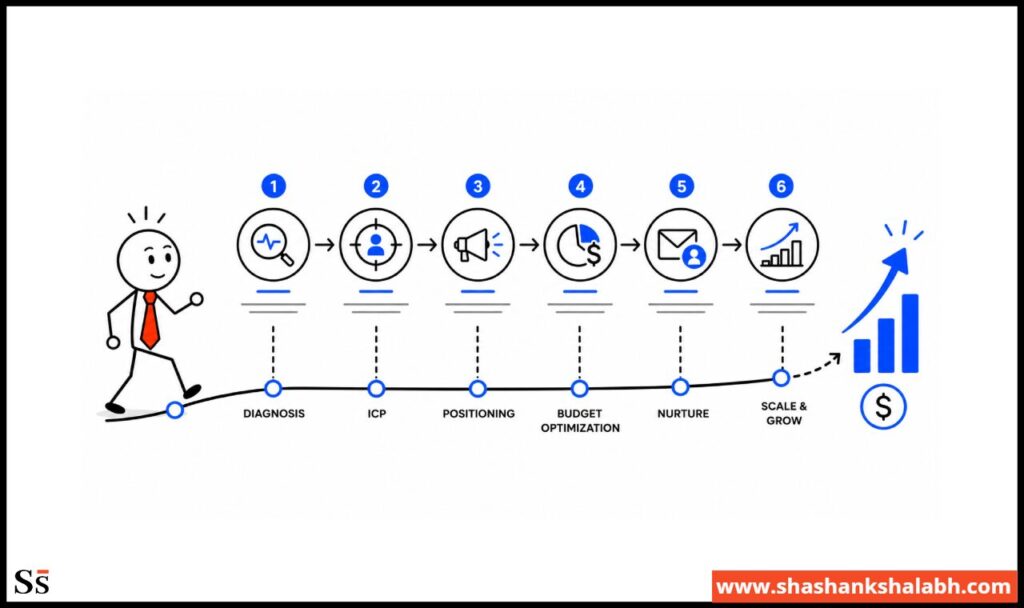
The fix sequence wasn’t random.
We prioritized each change based on what would create the biggest improvement and make the next fix more effective.
- Diagnose before intervening
- Fix ICP and measurement before changing channels or content
- Fix positioning and handoff before scaling volume
- Reallocate budget based on channel CAC data
- Add nurture and re-engagement to extract value from leads already generated
- Scale only after the system produces consistent conversion
The sequence matters because each fix builds on the one before it.
Refining the ICP makes the positioning sharper. Better positioning makes sales handoffs more effective. And channel reallocation only becomes clear once you understand CAC by channel using the right ICP.
For more on the full diagnostic framework, see Why Your Marketing Isn’t Driving Revenue.
What a Fractional CMO Brings to This Process
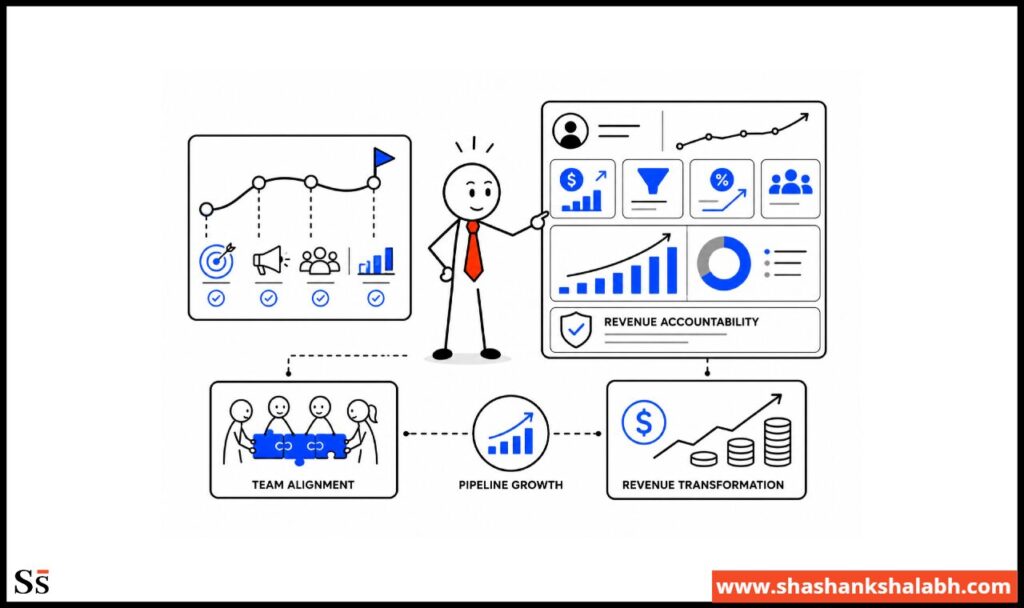
Pattern recognition
Having diagnosed the same combination of problems across multiple growth-stage companies, I can usually identify the root causes faster.
The gaps between the ICP and buying triggers, positioning that misses the real differentiator, and broken marketing-to-sales handoffs show up repeatedly at this stage.
Recognizing these patterns early helps me compress the diagnostic process from months to weeks.
Executive authority
ICP changes require CEO buy-in, especially when lead volume drops 40% in the first month. Handoff improvements require sales leadership alignment. Positioning changes affect every team communicating with customers.
These changes need executive support to move forward. They can’t be treated as just another marketing recommendation.
Revenue accountability
When pipeline contribution and CAC become the primary KPIs, priorities change.
As a fractional CMO accountable for pipeline, I focus on finding the real bottleneck and fixing it quickly because the outcome is clear: create more pipeline at a lower cost.
For more on what a fractional CMO owns in a full engagement, see Fractional CMO Responsibilities and Fractional CMO Services.
FAQ: B2B SaaS case study
How long does it take to triple the pipeline?
In this B2B SaaS case study, the pipeline tripled in six months, with improvements showing within the first few weeks.
The handoff fix increased MQL-to-SQL conversion by 73%, and channel reallocation drove an 85% pipeline increase by month four.
The biggest gains came later as content, nurture, and outbound efforts started contributing to pipeline.
What is the most common reason pipeline is stagnant?
In many B2B companies between $3M-$20M ARR with stagnant pipeline, the issue is a mismatch between who they target and when buyers are ready to act.
The most common problems are an ICP built around company segments instead of buying triggers, and a broken handoff that causes good leads to go cold before sales can engage.
In this engagement, both issues existed alongside generic positioning that made the product look similar to competitors instead of giving buyers a clear reason to choose.
Can pipeline be increased without increasing marketing spend?
Yes. This case study shows a specific example. Marketing spend increased by just $4,200 per month (12%), while pipeline increased by 233%.
The growth came from improving conversion efficiency. These changes didn’t require more budget. They made the existing budget work harder.
Adding spend to a broken system only scales the problem. Fix the system first, then increase investment.
What is a good MQL-to-SQL conversion rate for B2B SaaS?
For most B2B SaaS companies, a healthy MQL-to-SQL conversion rate is 30-50%, depending on the ICP, deal size, and sales process.
The 11% starting point showed two problems: poor-fit leads entering the funnel and a broken handoff process. Fixing the handoff alone moved conversion to 19% within three weeks. By month six, it reached 31%.
How do I diagnose why my pipeline isn’t growing?
Start with four data points: MQL-to-SQL conversion rate, CAC by channel, MQL response time, and the buying triggers behind your best customers.
These usually reveal where the problem is.
Low conversion points to ICP or handoff issues. Low pipeline volume points to top-of-funnel or channel problems. High CAC differences across channels point to budget misallocation.
The data usually shows the answer. You just need to ask the right questions.
Closing Thought
In this B2B SaaS case study, we did not add new channels, budgets or an agency.
It tripled because we fixed the ICP, positioning, handoff, content, and measurement issues that were limiting growth.
Better inputs created better outcomes.

Shashank brings over 22 years of global omnichannel marketing experience. As a 4x Chief Marketing Officer, he has helped several organizations (Startups and Fortune 500) drive sustainable revenue growth through strategic marketing.