
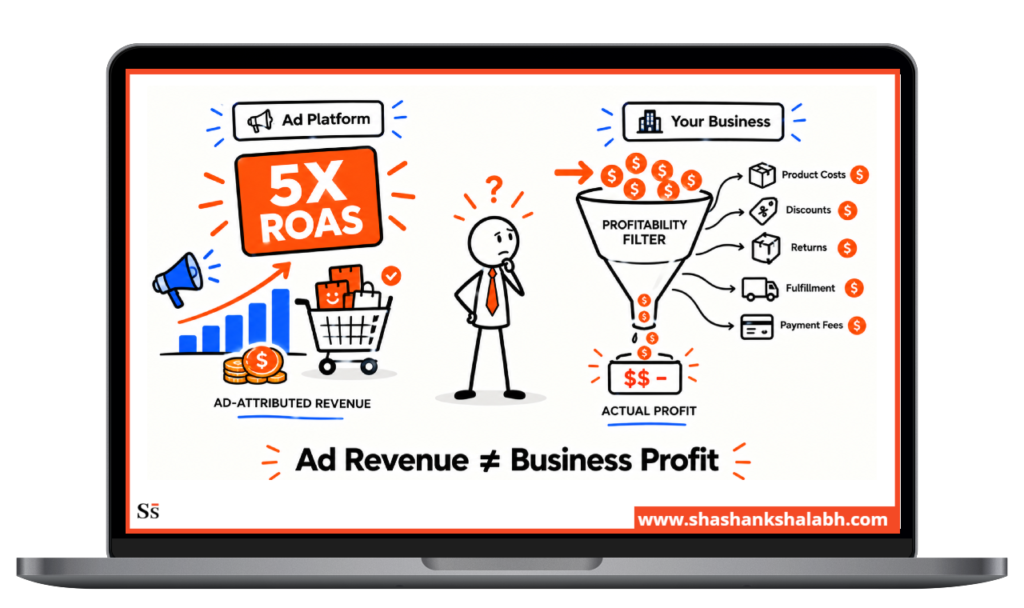
When you are hitting a 5x ROAS, you are overjoyed.
And the next logical thing is to scale. Right?
Here’s the thing.
Platform ROAS measures revenue attributed to advertising spend.
It says nothing about product costs, discounts, returns, fulfillment, or payment processing. And it does not answer whether that sale would have happened anyway.
Platform ROAS is not business profitability. While they’re related, they answer very different questions.
As a fractional CMO for DTC and ecommerce, I’ve seen founders staring at a 5x or 6x ROAS wondering why cash in the bank isn’t growing.
What ROAS Measures?
Here is the basic formula for ROAS.
ROAS = Attributed Revenue ÷ Advertising Spend
If you spend $10,000 and the platform attributes $50,000 in revenue, that’s 5x ROAS.
Simple, clean, and, on its own, almost meaningless as a profitability signal.
What ROAS does not include?
Depending on how the platform reports it, ROAS generally excludes:
- Cost of goods sold (COGS)
- Fulfillment and shipping costs
- Payment processing fees
- Returns and refunds
- Discounts and promo codes
- Agency fees and creative production costs
- Any other operating expense
A 5x ROAS does not automatically mean a profitable campaign.
It means the platform is confident it drove $5 of revenue for every $1 spent.
What happens to that $5 after it’s earned is an entirely separate calculation. And it’s the one that actually determines whether the campaign made you money.
→ Why Our DTC Revenue Is Growing But We’re Making Less Money?
Revenue vs. Contribution
Here are the metrics you need to know.
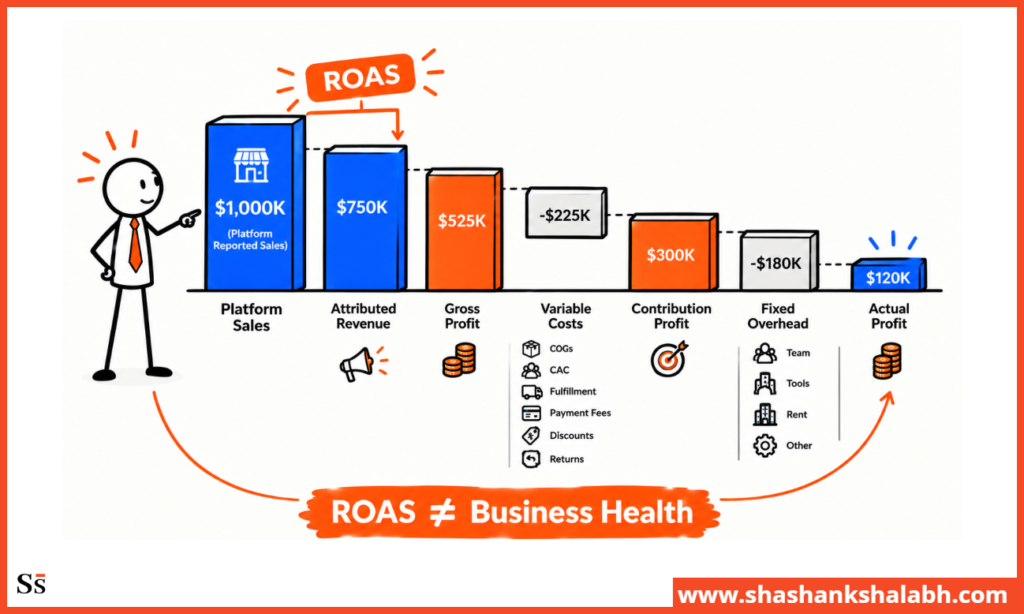
Revenue is your top-line number. This is what the platform reports as attributed sales.
Next is Gross Profit, which is Revenue minus COGS. This is already a meaningfully smaller number than what ROAS is showing you.
Contribution Margin is gross profit minus the variable costs of acquiring and fulfilling that order: CAC, fulfillment, payment fees, discounts, returns.
And lastly, we have Net profit, which is contribution margin minus fixed overhead. Or, what’s actually left.
The progression looks like this:
Ad Spend → Attributed Revenue → Gross Profit → Variable Costs → Contribution Profit → Operating Profit
ROAS lives entirely at the first arrow.
Your actual business health lives several steps downstream.
The problems I will discuss throughout this blog post come back to the same thing. The money you think you’re making isn’t making it to the bottom line.
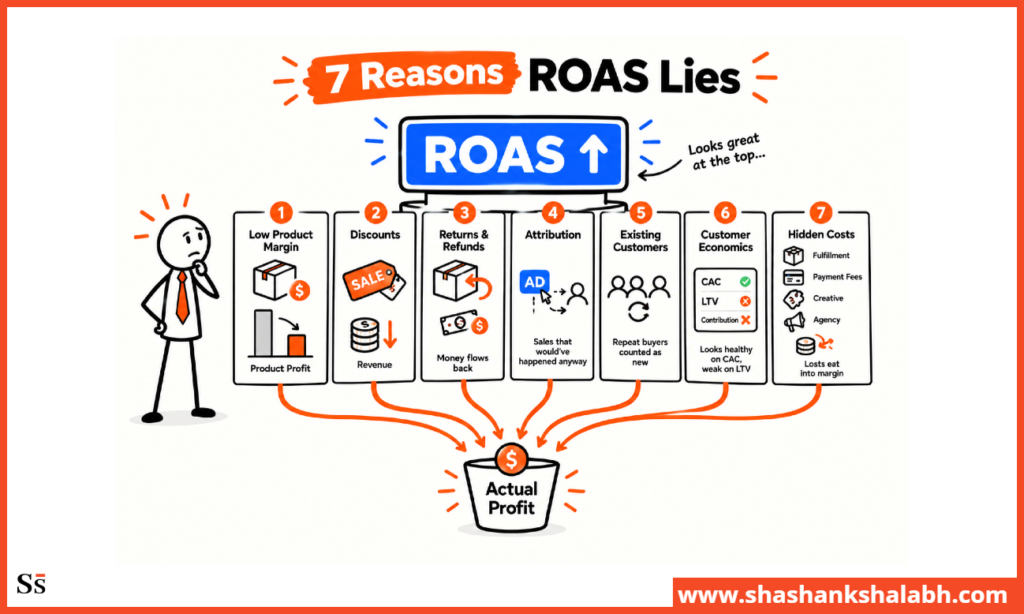
Problem 1: Your Product Margin Is Too Low
Take a simple example.
You make $100 in attributed revenue and spend $20 on ads.
That’s a 5x ROAS, which looks great on any dashboard.
But then product costs, fulfillment, and payment fees eat up $80. Now you’re left with almost nothing.
While the 5x ROAS was real, profit wasn’t.
Why High-Margin and Low-Margin Products Need Different ROAS Targets
A 5x ROAS means very different things depending on your margins.
At 70% gross margin, it can be highly profitable.
But, at 30%, you might barely break even.
Product Mix Can Distort ROAS
If you start selling more lower-margin products, your ROAS can stay the same or even go up while your actual profit goes down.
The ad platform only sees the sale. It doesn’t know how much you actually made.
Problem 2: Discounts Are Inflating Your ROAS
The platform takes credit for the full order value, even if the customer used a 20% discount code.
Look at your discount rate, average discount per order, how often you run promotions, first-order offers, and free shipping thresholds.
Gross Revenue vs. Net Revenue
This matters more than most founders realize.
A campaign showing 5x ROAS on gross revenue can look very different after discounts.
If every order is 20% off, your real ROAS is closer to 4x.
And if more customers are using discounts each month, that gap keeps getting bigger even when the platform still shows 5x.
Problem 3: You’re Not Accounting For Returns and Refunds
To the platform, an order is a win the moment it’s placed.
Returns, refunds, exchanges, return shipping, restocking, and customer service all happen after the sale but never show up in your ROAS.
Measure Revenue After Returns
This matters even more in apparel, beauty, and other categories with high return rates.
A campaign that looks like a clean 5x can look very different after returns.
Measure revenue after returns, not when the sale happens. That gap can be the difference between a profitable channel and one that’s quietly losing money.
Problem 4: Platform Attribution Isn’t the Same as Incremental Revenue
This is probably the most important and misunderstood part of the whole topic.
Attributed revenue addresses which touchpoint gets credit for the sale. Incremental revenue asks whether the sale would have happened without the ad.
Those are two very different questions, and ad platforms are built to answer the first one.
Why Multiple Platforms Can Claim the Same Customer
Meta, Google, TikTok, email, organic search, and direct traffic can all claim the same sale in their own reports.
Add up the attributed revenue from every channel and it can easily be higher than your actual revenue, sometimes by a wide margin.
Attribution Windows Matter
A 7-day click window can tell a very different story than a 28-day click window.
The longer the window, the more sales the platform can claim. Extending the window generally makes ROAS look better.
This is only because more purchases fall inside the credit-taking period.
View-Through vs. Click-Through Attribution
A view-through conversion gives an ad credit for a sale even when the customer never clicked it.
This can make ROAS look better, especially when the customer was already likely to buy.
Retargeting Can Make ROAS Look Particularly Strong
Check your retargeting campaigns, and I can almost bet, they would show one of the highest ROAS. This is because they reach people who already know the brand and may have bought anyway.
The platform’s math isn’t wrong.
It’s just showing you that attributed revenue and incremental revenue aren’t the same thing, especially at the bottom of the funnel.
Problem 5: You’re Counting Existing Customers as Acquisition Success
A customer who was already going to reorder can still get credited to your latest ad.
That can make your overall performance look better without actually bringing in any new customers.
New Customer ROAS vs. Blended ROAS
This is one of the most useful splits in DTC reporting.
If blended ROAS looks strong but new customer ROAS is weak, a lot of that revenue may be coming from existing customers rather than new growth.
Track new customer revenue, CAC, and ROAS separately from blended numbers. The picture can look very different.
Problem 6: CAC Looks Fine. Customer Economics Don’t.
First-order economics show whether you make or lose money on the first purchase.
60, 90, and 180-day customer value show what that customer is actually worth over time. LTV:CAC shows whether your acquisition costs make sense relative to that value, while payback period shows how long it takes to earn that acquisition cost back
A campaign can lose money on the first order and still be worth it if customers come back and buy again.
On the flip side, a strong first-order ROAS can hide a bigger problem if those customers never return. You only see that when repeat revenue stays flat over the next few months.
Problem 7: You’re Ignoring the Costs Around the Ad
Ad spend is rarely the only cost behind a campaign.
Agency fees, creative, influencers, affiliates, landing pages, and the tools you use all cost money, but none of them show up in platform ROAS.
Media ROAS measures the ads. Your actual economics include everything it takes to run them.
The ROAS Profitability Stack
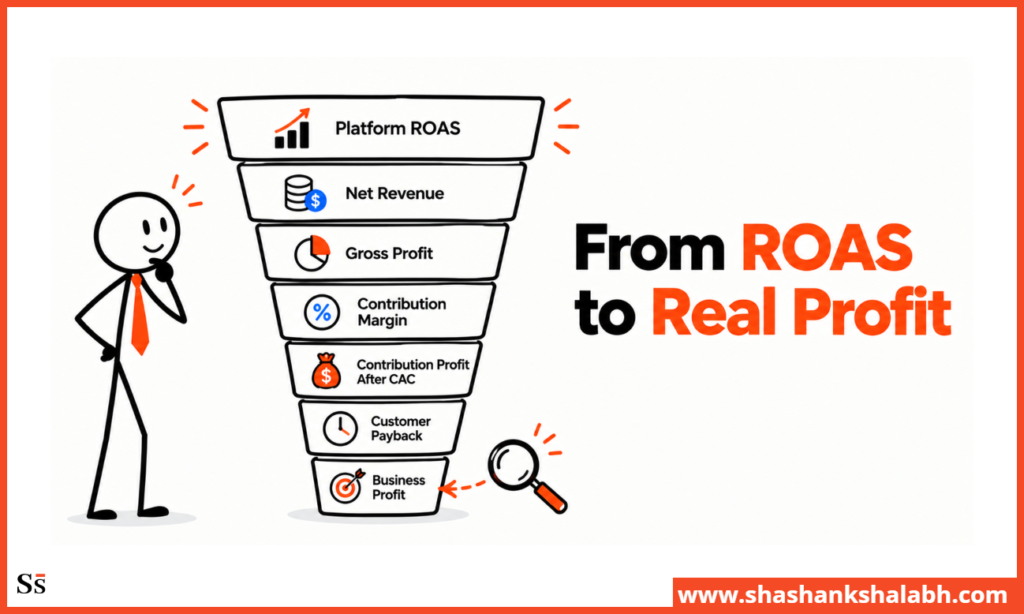
Platform ROAS → Net Revenue → Gross Profit → Contribution Margin → Contribution Profit After CAC → Customer Payback → Business Profit
Each step down this stack accounts for costs the platform doesn’t see.
By the time you get to business profit, the number is usually much smaller than where you started.
And that’s the number that tells you whether scaling actually makes sense.
What Should You Measure Instead of ROAS?
ROAS is useful, but it only tells you part of the story.
Look at it alongside CAC, new customer CAC, gross margin, contribution margin, contribution profit after CAC, AOV, discount rate, return and refund rate, repeat purchase rate, LTV, and payback period.
How to Calculate Your Real Advertising Economics
Here are the steps to help you assess your advertising economics.
- Start with Attributed Revenue from the platform
- Remove discounts and refunds to get Net Revenue
- Calculate Gross Profit by subtracting COGS
- Subtract variable fulfillment and payment costs
- Subtract acquisition cost for that period. And you have your Contribution profit
- Split the analysis by new vs. existing customers
- Break the whole thing out by channel
There’s no single formula for contribution profit.
Every company defines it a little differently. Pick a formula, document it, and stick with it so your numbers stay consistent over time.
Example: How a 5x ROAS Campaign Can Still Lose Money
Let’s say you have $100,000 in attributed revenue and spend $20,000 on ads. That gives you a 5x ROAS, which looks great.
But now take out the actual costs. $35,000 in COGS, $8,000 in discounts, $9,000 in fulfillment and payment processing, and another $6,000 in returns and refunds.
You’re left with about $22,000 in contribution profit against $20,000 in ad spend.
That 5x ROAS suddenly looks a lot less impressive.
You’re basically at break-even.
Is Your ROAS Actually Healthy?
There’s no universal “good ROAS.”
It depends on your margins, AOV, CAC, repeat purchases, return rate, discounts, and fixed costs.
A 3x ROAS can be profitable for one business and a 6x ROAS can lose money for another. The number only makes sense when you look at the economics behind it.
Questions DTC Founders Should Ask Before Scaling
- How much contribution profit does each new customer actually generate?
- What is our new customer CAC (not blended)?
- What percentage of attributed revenue is coming from existing customers?
- How much revenue is being lost to returns and refunds?
- What is our gross margin by product?
- How much are discounts reducing realized revenue?
- How much of this revenue is incremental?
- What is our payback period on new customers?
- Which channels produce the best customer economics (not just the best ROAS)?
- Are we optimizing for revenue, or for profitable growth?
When ROAS Should Not Be Your Primary Marketing KPI
Sometimes another metric matters more.
That can be the case when entering a new market, building brand awareness, selling subscriptions, driving repeat purchases, or using channels where attribution is less reliable.
ROAS still has a place. Just look at it alongside the numbers that actually drive your business.

When a DTC Brand Needs to Rethink Its Growth Strategy
Sometimes the problem is bigger than the campaign.
ROAS looks good, but cash is tight. CAC keeps climbing, discounts are doing more of the heavy lifting, new customer economics are unclear, and every channel seems to be telling a different story.
Marketing talks about revenue, but no one is looking at contribution profit or connecting ad spend to actual profitability.
When you see two or more of these issues, it may be time for a fractional CMO for DTC & Ecommerce to connect ad spend to actual profitability.
FAQ: DTC ROAS looks good but not profitable
Can you have a high ROAS and still lose money?
Yes. If product margin, discounts, returns, or fulfillment costs consume most of the attributed revenue, a high ROAS campaign can still produce little to no real profit.
Why is my ROAS good but my business isn’t profitable?
ROAS doesn’t account for COGS, discounts, returns, payment fees, or overhead.
It’s entirely possible to look excellent on the platform and be marginal or unprofitable once real costs are included.
What is a profitable ROAS?
There’s no universal number. It depends on your gross margin, contribution margin, CAC, AOV, and repeat purchase economics.
The same ROAS can be highly profitable in one business and unprofitable in another.
Is ROAS more important than profit?
No; ROAS is a media efficiency signal, and profit is the actual business outcome.
So “Profit” should always take priority in decision-making.
What’s the difference between ROAS and ROI?
ROAS measures revenue against ad spend alone. ROI accounts for total costs and reflects actual return on the full investment.
How do discounts affect ROAS?
They inflate the attributed revenue figure while reducing what you actually keep per order, widening the gap between platform-reported and real performance.
Does ROAS include COGS?
No. ROAS is purely revenue divided by ad spend.
Cost of goods is never part of the calculation.
Why is Meta ROAS different from actual revenue?
Attribution windows, cross-platform overlap, and view-through credit can all cause platform-reported revenue to exceed real incremental revenue.
Should I optimize for ROAS or contribution margin?
Optimize for contribution margin.
ROAS is a useful diagnostic layer for evaluating media efficiency, but contribution margin is what actually tells you whether the spend is making the business money.

Shashank brings over 22 years of global omnichannel marketing experience. As a 4x Chief Marketing Officer, he has helped several organizations (Startups and Fortune 500) drive sustainable revenue growth through strategic marketing.