
Take a look at most B2B SaaS growth content, and you will see that they describe what to do in theory.
As a CMO and fractional CMO, I have seen this more than I want to admit.
That is why I wanted to share my own experience, with the exact steps (not theory).
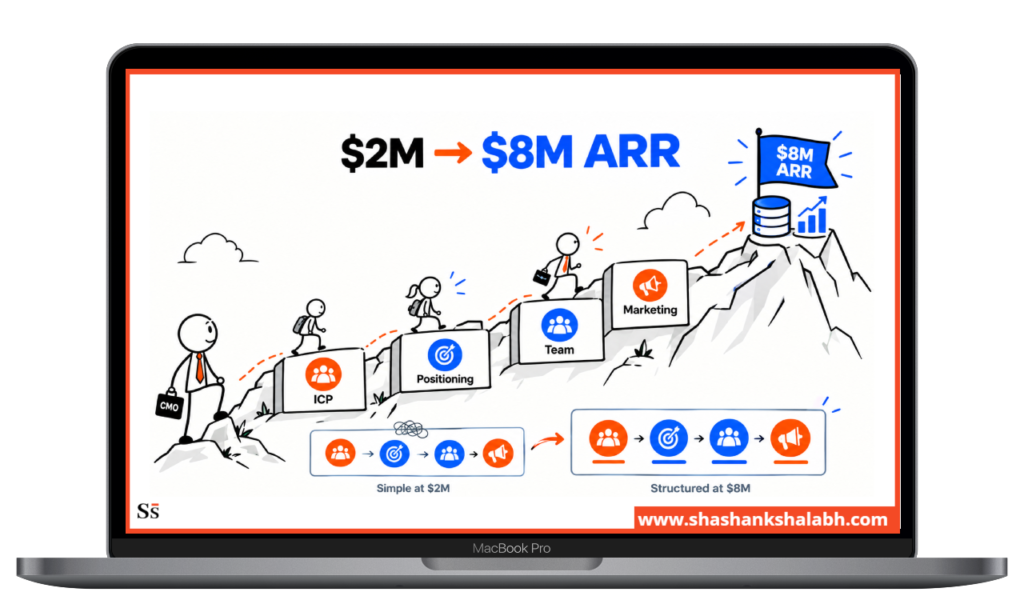
You will learn how we scaled a business from $2M to $8M ARR over 22 months.
I will also share what drove growth at each stage, what failed as the business scaled, and what had to change to keep growing.
Through this case study, you will learn structural decisions related to the ICP, positioning, team, and marketing architecture that determined whether the next dollar of growth was efficient or expensive.
What we will cover in this Case Study:
- Why $2M to $8M ARR is the hardest growth stretch in B2B SaaS
- What was working and what was already breaking
- Three growth stages with specific decisions, solutions, and results
- Seven structural decisions that drove the growth
- How to apply the lessons to your specific ARR stage
Note: Business details and specific figures have been modified to protect client confidentiality. The outcomes, decisions, and improvement patterns reflect real engagement results.
Why $2M to $8M ARR Is the Hardest Stretch?
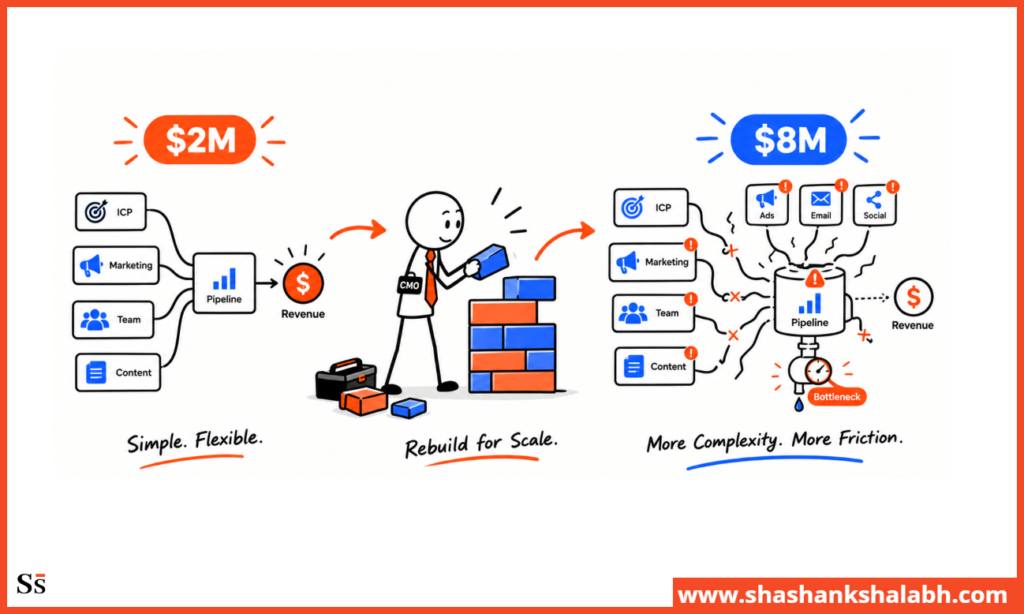
What Gets You to $2M Won’t Get You to $8M
At $2M ARR, most B2B SaaS startups are growing through founder relationships, early adopter networks, and product-led word of mouth.
These sources produce the first $2M reliably, but they almost never produce the next $6M.
The jump from $2M to $8M means building a growth engine that doesn’t depend on the founder. You need to know exactly who you’re targeting, figure out what reliably brings them in, and build a sales and marketing process that keeps the pipeline moving without you being involved in every deal.
What Starts to Break at This Stage
The founder can’t close every deal anymore. There’s no repeatable sales process to take over.
The ICP gets broader. Early adopters bought on instinct, while mainstream buyers need more proof, clarity, and confidence.
CAC starts climbing. Founder-led referrals run out, and paid channels get added without a clear strategy. Sales cycles get longer.
Bigger, more cautious buyers take more time to make a decision.
And lastly, marketing gets busier. The team grows, but the work doesn’t translate into more pipeline (revenue).
Why This Breakdown Matters to You
If you’re at $2M-$5M ARR, these problems are likely ahead.
Seeing them early gives you a chance to make better decisions around ICP, positioning, and channels before growth starts to slow.
If you’re at $5M-$8M ARR and growth has already slowed, you’re probably dealing with some of these issues now. The first step is figuring out what’s actually broken.
Context and Starting Point
Company Profile at $2M ARR
- Product: B2B SaaS; workflow automation for professional services firms
- ARR at engagement start: $2.1M. 18 months post-launch
- Team: 11 people. 2 founders, 4 engineers, 2 customer success, 1 salesperson, 1 marketer, 1 operations
- Monthly marketing spend: $18,000; primarily content and founder outreach
- Gross margin: 80%
- Revenue from founder-sourced or direct referrals: 94%
- NRR: 108%. Strong product, customers expanding
- CAC: $4,200; low because acquisition was primarily founder relationships
- Average ACV: $14,400
- CAC payback: approx. 7 months at 80% gross margin ($4,200 ÷ [$1,200 × 0.80] = 4.4 months to gross margin recovery, refined in later stages)
What Was Working at $2M ARR
Product-market fit was clear, with NRR above 100% showing customers were getting enough value to expand.
Retention wasn’t an issue. The product worked.
Founder relationships were also driving steady referrals through a strong professional services network. This gave the team a reliable source of warm introductions, even if the pipeline wasn’t yet systematic.
And with a small team, decisions were fast and implementation was easy. Surely, this was an advantage that became harder to maintain as the company grew.
What Was Already Breaking at $2M ARR
The founder was spending 60% of their time on sales, which worked for 18 months but wouldn’t support an $8M business.
There was no clear ICP beyond “professional services firms,” no demand generation engine, and no repeatable sales process.
Revenue depended heavily on the founder’s network, while the lone salesperson had no playbook to follow. Marketing was sporadic, with no keyword strategy, attribution, or clear link to pipeline.
Stage 1: $2M to $4M ARR (Months 1-9)
The Primary Growth Challenge at This Stage
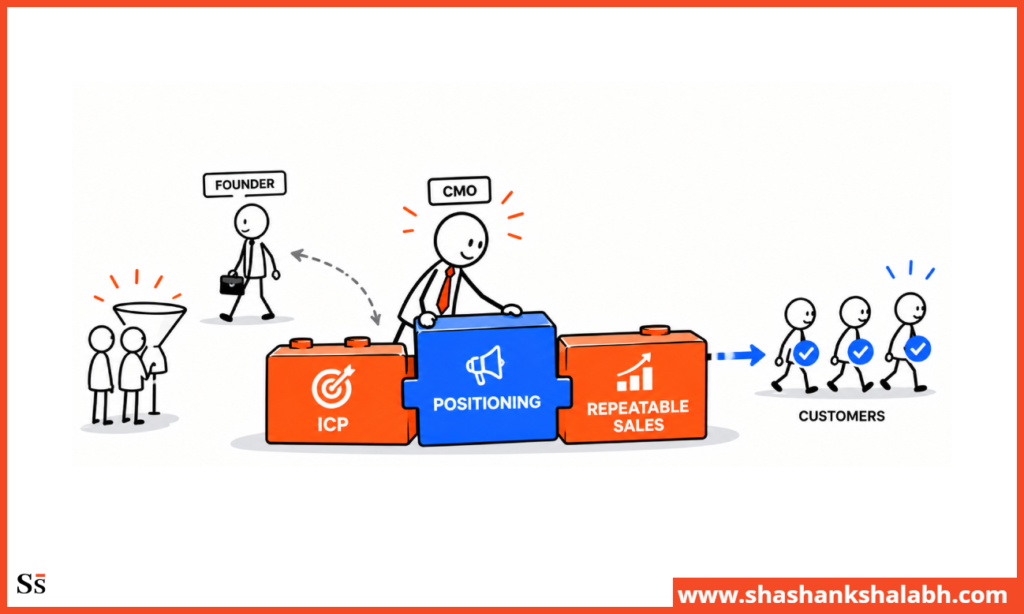
We prioritized three goals for Stage 1:
- Reduce reliance on founder sourced deals
- Define the ICP and positioning before scaling paid spend
- Prove the company could grow without the founder in every sales call
Rather than launch paid acquisition right away, we built the ICP first. A broad ICP would have meant expensive leads that didn’t convert. That upfront work helped keep CAC lower from the start.
Strategy: Months 1-3
We rebuilt the ICP from 18 months of closed-won data.
The analysis showed that “professional services firms” was too broad.
71% of the best customers were accounting and legal firms with 10 to 50 employees using the same practice management software.
The key finding was the buying trigger.
80% of closed won deals came from firms that had recently hired their first operations manager, who often became the internal champion. That event created urgency and predicted conversion better than firm size or industry.
The real ICP became accounting and legal firms with 10 to 50 employees, using specific software, that had recently hired an operations manager.
It was narrow, but actionable.
We rebuilt the positioning around what actually drove purchases.
Instead of generic “workflow automation,” we led with the product’s native integration with the practice management software their ICP already used.
There was no middleware or manual sync. The key buying reason moved from page three to the homepage.
The content strategy focused on what accounting and legal operations managers actually search for when they have a problem.
Instead of broad terms like “workflow automation software,” we targeted specific operational challenges and built content around those searches.
Strategy: Months 4-6
We launched Google Search around high intent ICP specific queries instead of broad category terms.
While the volume was low, conversion was high.
We also built outbound around the buying trigger, targeting firms that had recently posted operations manager roles with messaging tied to their first 30 days.
Finally, we documented the founder’s sales process, including discovery, objections, and competitive differentiation, so others could follow it.
We set a 24 hour SLA for MQLs, automated CRM alerts for uncontacted leads, and added a weekly marketing and sales pipeline review.
Results at $4M ARR: Month 9
| Metric | Month 1 | Month 9 | Change |
| ARR | $2.1M | $4.1M | +95% |
| Founder time on sales | 60% | 35% | −25pp |
| Marketing-sourced pipeline | ~0% | 28% | +28pp |
| CAC (blended) | $4,200 | $6,800 | +62% |
| Paid search CAC | — | $7,200 | New channel |
| MQL-to-SQL conversion | N/A | 24% | Baseline |
CAC rose from $4,200 to $6,800 as paid channels replaced founder sourced deals. This was expected.
Founder-sourced CAC looked lower because it didn’t account for their time.
At $14,400 ACV and 80% gross margin, the $6,800 paid CAC delivered a 7.3 month payback. MQL to SQL reached 24% because we defined a tight ICP before launching paid acquisition.
Stage 2: $4M to $6M ARR (Months 10-16)
The Primary Growth Challenge at This Stage
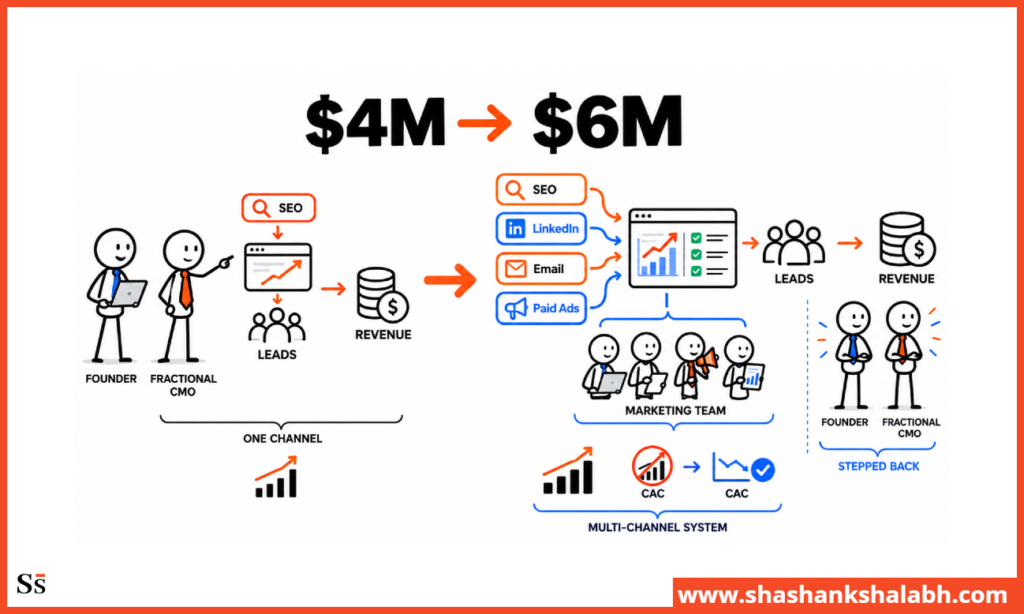
We set four objectives for Stage 2:
- Scale the channels that proved out in Stage 1
- Build the marketing team to reduce founder and fractional CMO involvement in execution
- Introduce a second acquisition channel to eliminate single-channel risk
- Fix rising CAC before it became a structural problem
What Broke Moving From $4M to $6M
Paid search CAC began rising
The market for target keywords became more competitive as the company’s positioning attracted imitators. A channel that worked efficiently at $4M was showing stress signals by $4.5M.
Content attracting inconsistent quality
Traffic was growing, but the lead quality from organic was inconsistent.
Some pieces were attracting ICP-fit buyers, but others attracted practitioners researching general topics. The content team was optimizing for traffic rather than buyer alignment.
Sales team grew from 1 to 3, without a mature playbook
New hires were underperforming the original salesperson significantly.
Ramp time was running 4-5 months. The playbook documented in Stage 1 was functional but incomplete.
First marketing hire made incorrectly
A generalist content marketer hired without clear strategic direction was producing high output, but low pipeline contribution.
What We Fixed in Months 10-13
We expanded the sales playbook using insights from closed won deals.
We refined discovery questions, documented the five most common objections, and tested competitive positioning in real sales calls. Once the playbook was complete, new hire ramp time dropped from five months to nine weeks.
We stopped publishing for volume and focused on eight high intent topics tied to ICP buying questions.
Content dropped from 12 pieces a month to four, with each piece tied to a buying stage and buyer question. Traffic dipped, but lead quality improved immediately.
We launched a LinkedIn pilot targeting operations managers at accounting and legal firms with 10 to 50 employees using the target practice management software.
The targeting matched the ICP closely. After 60 days, CAC reached $8,400, validating LinkedIn as a second acquisition channel and earning it a permanent place in the mix.
We shifted the marketing hire from content volume to content quality. And cut output from 12 pieces a month to four, with each piece tied to a specific ICP buying stage. Pipeline contribution became the primary content KPI.
What We Built in Months 14-16
We turned the ICP’s reliance on one practice management software into a partner channel. The software vendor already served the exact target market, creating a natural co-marketing and referral opportunity.
The partnership delivered a $3,200 CAC, the lowest of any channel, with highly qualified referrals driven by the vendor’s endorsement.
We built an NRR program around expansion triggers, aligning customer success and marketing on the usage patterns and firm changes that signaled expansion.
NRR rose from 108% to 119%, increasing LTV from the same customer base and improving overall unit economics.
CAC payback improved from about 7.3 months at the end of Stage 1 to around 7 months at the end of Stage 2.
The improvement came mainly from higher NRR and LTV, not lower CAC.
At $7,100 CAC, $14,400 ACV, and 80% gross margin, payback was about 7.4 months, which rounds to 7 months.
Results at $6M ARR: Month 16
| Metric | Month 9 | Month 16 | Change |
| ARR | $4.1M | $6.2M | +51% |
| Marketing-sourced pipeline | 28% | 41% | +13pp |
| CAC (blended) | $6,800 | $7,100 | +4% |
| CAC: Paid search | $7,200 | $9,800 | +36% |
| CAC: LinkedIn | New | $8,400 | New channel |
| CAC: Partner | New | $3,200 | New channel |
| NRR | 108% | 119% | +11pp |
| CAC payback | ~7.3 months | ~7 months | −4% |
| Founder time on sales | 35% | 15% | −20pp |
Channel CAC variance: Blended CAC of $7,100 hid a $6,600 gap between the best channel, partner referrals at $3,200, and the most expensive, paid search at $9,800. Tracking CAC by channel exposed the difference and led to a budget shift that helped grow the partner channel.
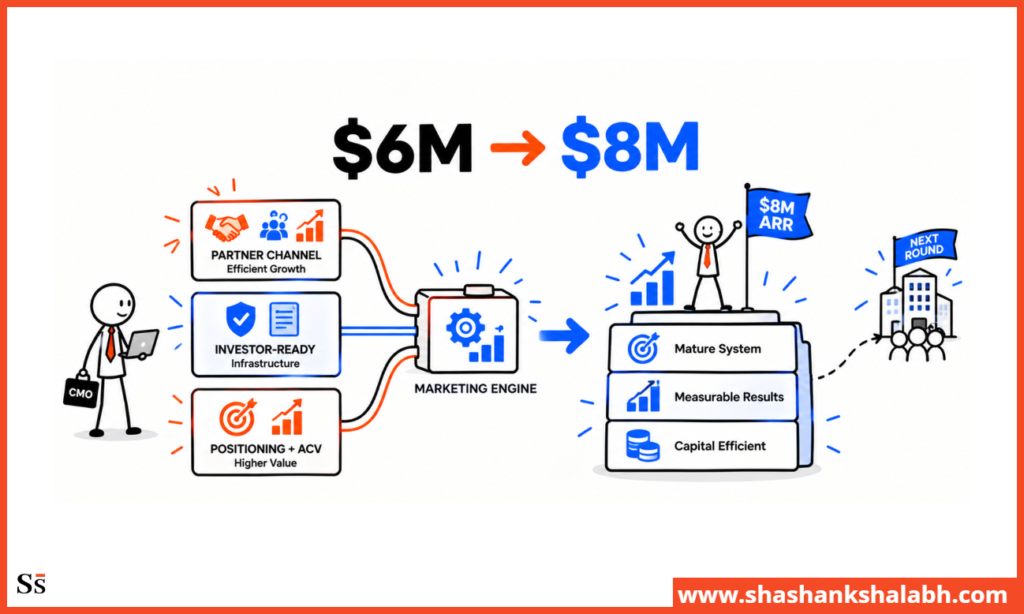
Stage 3: $6M to $8M ARR (Months 17-22)
The Primary Growth Challenge at This Stage
This was the phase of Series A preparation alongside continued growth:
- Build institutional marketing infrastructure that would pass investor diligence
- Prove repeatable, capital-efficient customer acquisition to institutional investors
- Scale the partner channel — the highest CAC efficiency source
- Evolve positioning for the higher ACV needed to hit Series A metrics
What Broke Moving From $6M to $8M
Series A fundraising exposed gaps in reporting.
Investors wanted trailing 12 month CAC, LTV:CAC by acquisition cohort, and marketing sourced revenue.
But the business wasn’t tracking them systematically. The data existed, but the reporting infrastructure didn’t.
The partner channel drove 35% of pipeline at the lowest CAC in the mix.
That made it a strong growth channel, but also created concentration risk. If the partnership changed, a significant share of the most efficient pipeline would disappear.
The two person marketing team was hitting its limit as pipeline targets grew ahead of Series A. Two marketers couldn’t keep up with the increasing demand.
The positioning needed to evolve.
“Workflow automation for professional services firms” worked at $2M and could support growth to $6M, but moving upmarket required a more strategic story.
The new positioning, “revenue operations platform,” better supported higher ACVs and the 50 to 200 employee segment.
What We Built in Months 17-19
We built board ready reporting from scratch, tracking trailing 12 month CAC by channel, LTV:CAC by acquisition cohort, monthly pipeline coverage, and marketing sourced revenue with documented attribution.
It took six weeks.
Because we built it early, they had 12 months of clean data by Month 29, when they raised, instead of scrambling to recreate it during diligence.
We implemented first touch and multi touch attribution in the CRM and documented the methodology for investor diligence. The partner channel’s contribution, previously assumed, became measurable and defensible.
We repositioned the product as a revenue operations platform and raised the new business ACV target from $14,400 to $22,000.
The new positioning supported expansion into the 50 to 200 employee segment while keeping the core 10 to 50 segment. We tested the new messaging on existing pipeline before rolling it out fully.
What We Built in Months 20-22
We expanded the partner channel from one source to four by adding three integration partners that served the same ICP.
Referral agreements kept the economics intact while reducing the risk of relying on a single partner.
We made a deliberate third marketing hire: a demand generation specialist to remove the execution bottleneck without changing the strategy. The role focused on paid search, LinkedIn, and outbound sequences.
We rebuilt outbound for the 50 to 200 employee segment, the secondary ICP for the new revenue operations positioning. Sales cycles were longer, ACVs were higher, and more stakeholders were involved, so the messaging and sequences changed accordingly.
The startup closed its Series A with $12M raised. Marketing diligence went smoothly because the reporting infrastructure had been in place for 12 months, rather than built in response to investor requests.
Results at $8M ARR: Month 22
| Metric | Month 16 | Month 22 | Change |
| ARR | $6.2M | $8.1M | +31% |
| Marketing-sourced pipeline | 41% | 47% | +6pp |
| CAC (blended) | $7,100 | $8,200 | +15% |
| CAC payback | ~7 months | ~6.1 months | −13% |
| NRR | 119% | 122% | +3pp |
| LTV:CAC | — | 4.8:1 | Strong |
| Founder time on sales | 15% | 8% | −7pp |
At Stage 3, CAC reached $8,200 as ACV rose to $22,000, with 80% gross margins. That put payback at 5.6 months on new business, or about 6.1 months blended across old and new ACVs.
With NRR at 122% and 80% gross margin, LTV:CAC improved significantly.
Rather than overstate a precise ratio, we used it as a directional indicator. Higher ACV, stronger NRR, and controlled CAC all improved the unit economics.
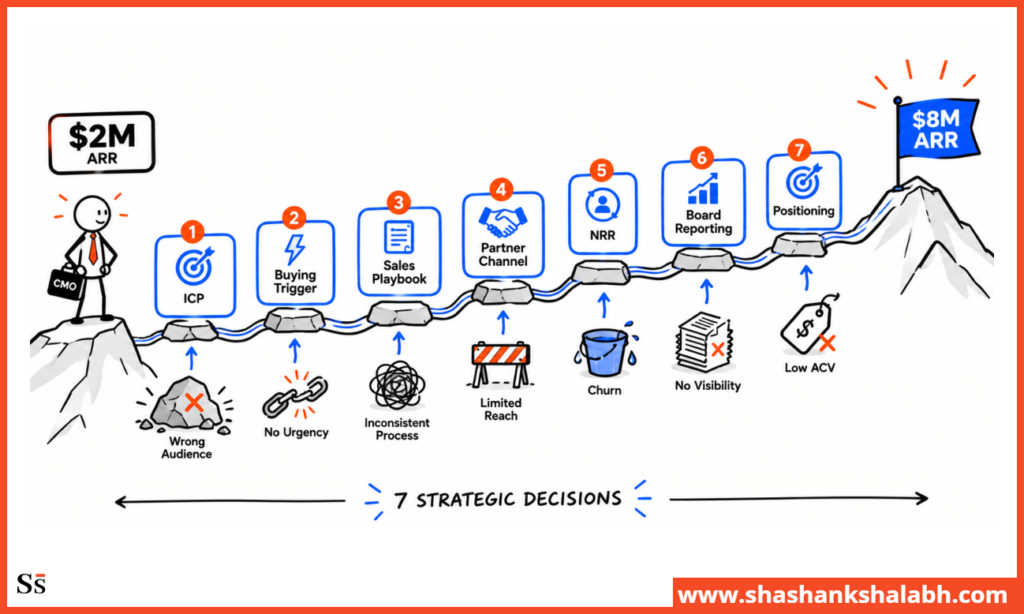
The 7 Decisions That Drove the Growth
Rebuild ICP Before Launching Paid Acquisition
We delayed paid acquisition until the ICP was tight. That led to 24% MQL to SQL conversion from day one because the targeting was specific before spending began.
Four weeks of ICP work upfront avoided months of costly optimization later.
Find the Buying Trigger, Not Just the Buyer Profile
A recent operations manager hire predicted conversion better than any firmographic factor.
Firms with the right size and software but no recent hire converted at a much lower rate. Reaching out when the job posting appeared drove stronger conversion than standard targeting. The buying trigger was the difference.
Fix the Sales Playbook Before Scaling the Sales Team
Hiring salespeople without a playbook led to underperformance and five month ramp times. Documenting the best salesperson’s process cut ramp time to nine weeks.
Across three salespeople, that recovered roughly 12 months of selling capacity in the first year.
Build the Partner Channel From the ICP Insight
The specific practice management software started as an ICP targeting signal and became a partnership opportunity.
At $3,200 CAC, the partner channel became the most efficient channel in the mix. The insight was already in the ICP data.
Defining the ICP precisely revealed it. Many companies can find similar partner opportunities by identifying the tools and services their best customers share.
Improve NRR Before Scaling Acquisition
NRR rose from 108% to 122%, improving LTV across the customer base.
That made the same CAC more efficient and strengthened LTV:CAC. Improving retention can have as much impact on unit economics as reducing CAC, yet most companies focus far more on acquisition.
Build Board-Ready Reporting Before the Fundraise, Not During It
Businesses that build investor grade reporting during diligence end up scrambling to explain the previous 18 months with three months of clean data.
Investors notice.
Building the reporting system at Month 17 gave the team 12 months of clean CAC, LTV:CAC, and marketing sourced revenue data by the raise. That six week investment made the fundraising story stronger and more credible.
Evolve Positioning for the Next Stage, Not the Current One
“Workflow automation for professional services firms” worked at $2M ARR but became limiting at $8M.
It couldn’t support higher ACVs or the move upmarket.
We shifted to “revenue operations platform” before the fundraise and tested it on existing pipeline first.
Proactive positioning builds the next message before the current one hits its ceiling.
⟶ Go-To-Market Strategy for Scaling Companies
What This Means for Your Startup?
If You’re at $1M-$3M ARR
Your first priority should be defining the ICP and identifying the buying trigger before launching paid acquisition.
Founder sourced growth may be working, but building a repeatable acquisition engine now is cheaper than fixing one after growth stalls.
The partner opportunity may already be in your ICP. Look for the software or services your best customers share. Those relationships can become high intent referral channels with better CAC than paid acquisition.
If You’re at $3M-$6M ARR
Founder dependency is likely already limiting growth. If more than 50% of pipeline comes from founder relationships, the replacement system isn’t working yet.
Track CAC by channel. Blended CAC can hide channels costing two or three times more than your best one. Once you see the gap, budget shifts become obvious.
Your sales playbook also needs to be documented. If new reps take more than 90 days to close their first deal, the playbook is likely the problem.
If You’re at $6M-$10M ARR
Build investor grade reporting now, not during diligence. Track trailing 12 month CAC, LTV:CAC by acquisition cohort, and marketing sourced revenue at least 12 months before the raise.
Positioning should evolve before the current message stops working. The message that drove the first $5M may not resonate with enterprise buyers at $10M+.
NRR is one of the highest leverage metrics at this stage. A two to three point improvement lifts LTV across the customer base and can strengthen unit economics more than an equivalent CAC reduction.
Closing Thought
The path from $2M to $8M ARR wasn’t linear, and it wasn’t luck.
It came from making the right decisions at the right time: who to target, how to position, which channels to build, and when to evolve.
I have seen a majority of businesses wait until growth slows down to make these decisions. The ones that get ahead of it move faster and spend less along the way.

Shashank brings over 22 years of global omnichannel marketing experience. As a 4x Chief Marketing Officer, he has helped several organizations (Startups and Fortune 500) drive sustainable revenue growth through strategic marketing.